Figure 1. A typical 1D 1H NMR spectrum of vitreous eye fluid from a uveitis patient. A: The original spectrum labeled to show the regions in which some typical biofluid components are known to give rise to resonances.
The spectrum has been scaled to highlight the detail; the inset is the unscaled whole spectrum. B: A data reduced spectrum in which the region between 4.5 and 5 ppm has been deleted so that any contribution from residual
water signal is eliminated. This spectrum has been “binned” into 0.005 Hz regions.
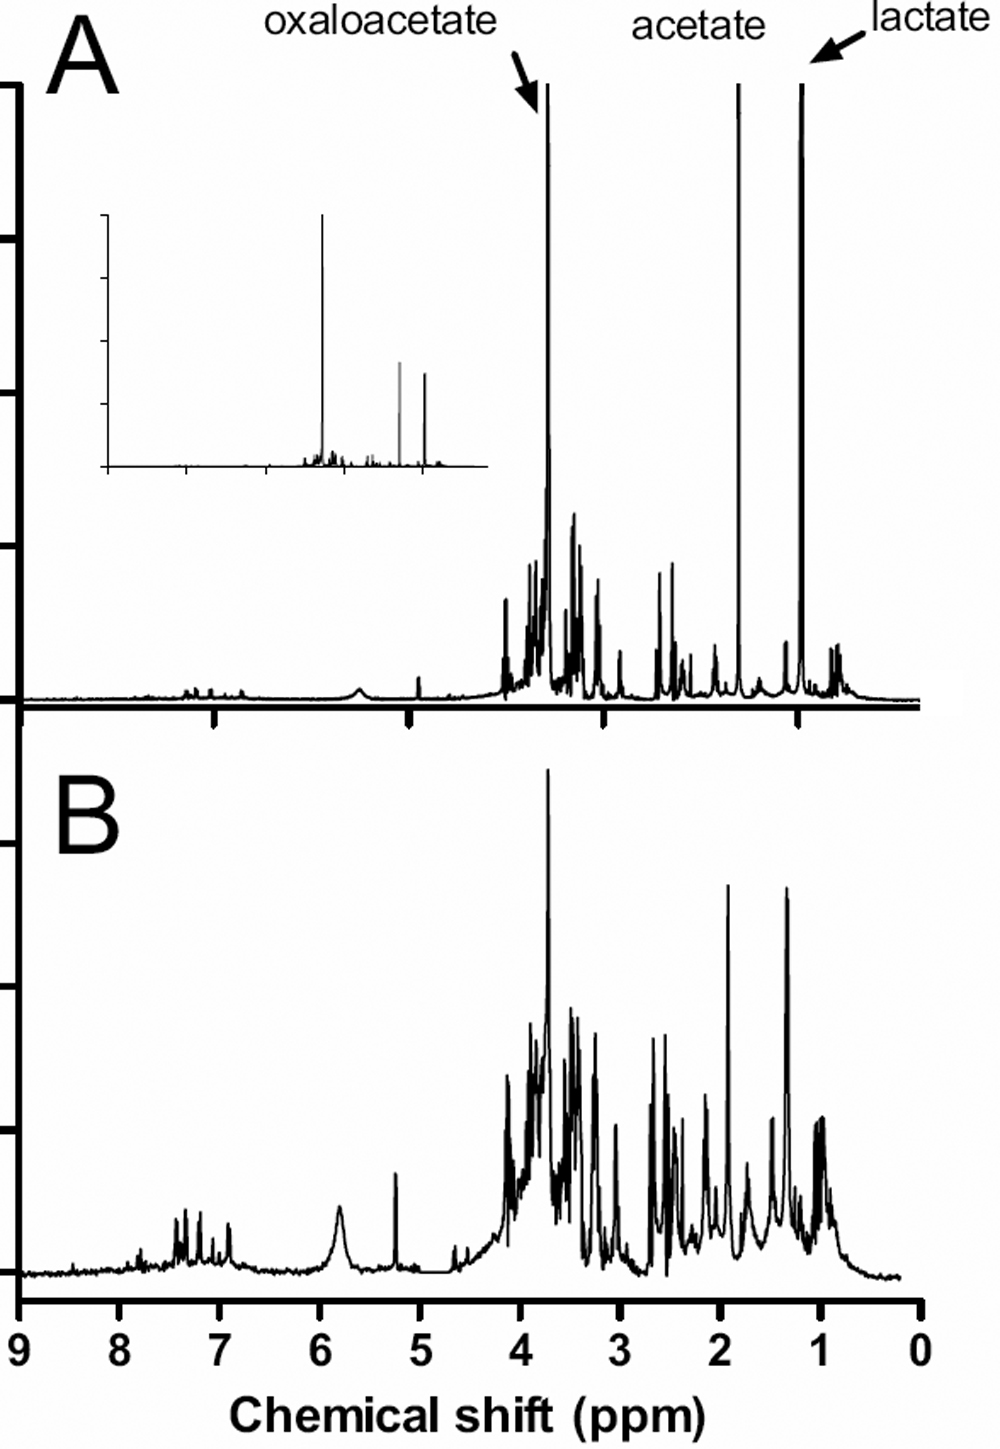
 Figure 1 of
Young, Mol Vis 2009; 15:1210-1217.
Figure 1 of
Young, Mol Vis 2009; 15:1210-1217.