Figure 6. Evaluation of functional changes by electroretinography. Measurements of ERG a- and b-wave amplitudes (±SD) were made in Fat1+/TG2+,
Fat1–/TG2+, Fat1+/TG2–, and Fat1–/TG2– mice maintained in 20 lx cyclic light (n≥10). The a-wave (A, B) and b-wave (E, F) amplitudes are from nine flash intensities at 4 weeks and 16 weeks. C, D are the average a-wave amplitudes of transgenic mice at 4 weeks and 16 weeks of age. E, H are b-wave amplitudes.
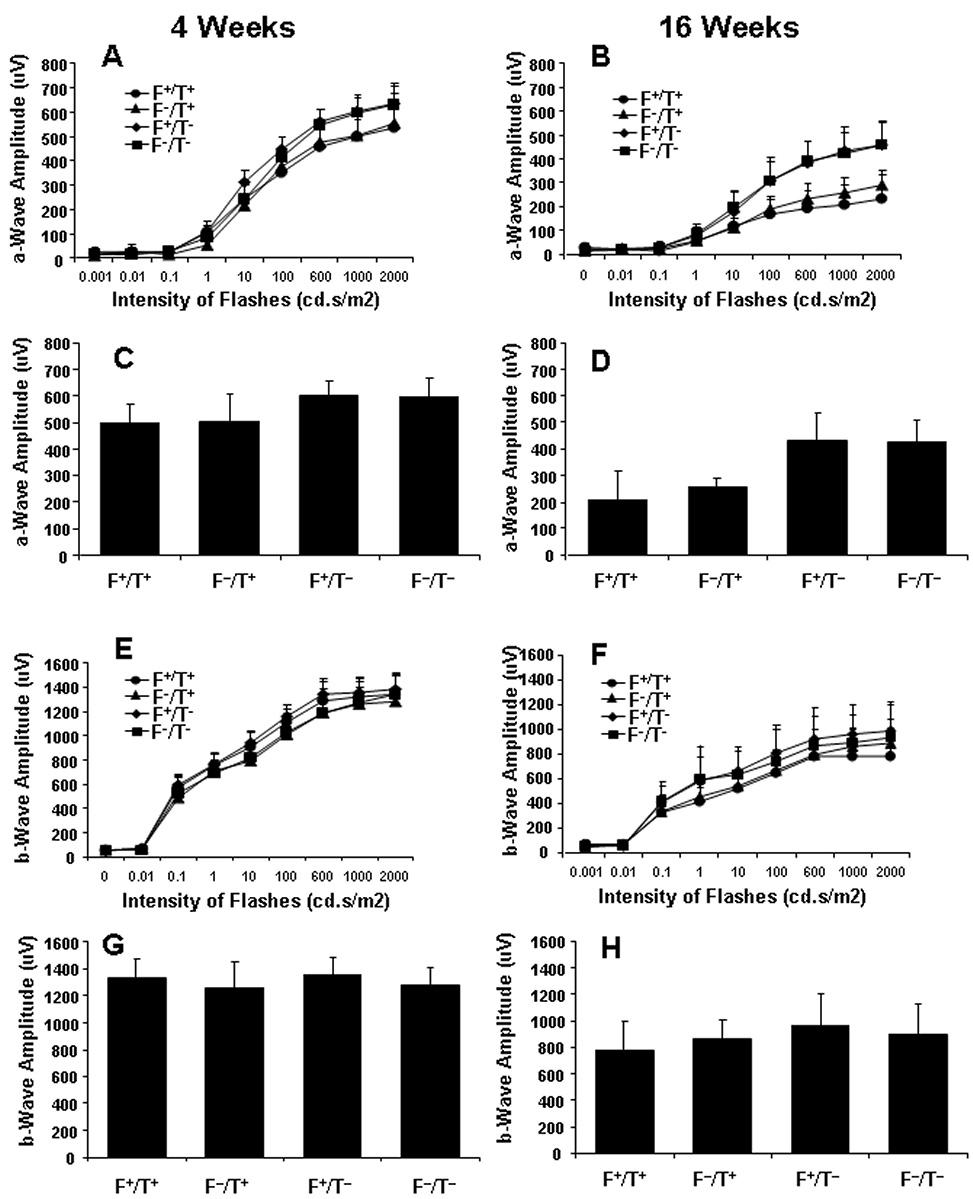
 Figure 6 of
Li, Mol Vis 2009; 15:1185-1193.
Figure 6 of
Li, Mol Vis 2009; 15:1185-1193.