Figure 5. Quantification of morphologic changes in transgenic mice. Measurements of ONL thickness (±SD) were made along the vertical
meridian of the eye in Fat1+/TG2+, Fat1–/TG2+, Fat1+/TG2–, and Fat1–/TG2– mice maintained in 20 lx cyclic light (n≥8). A, C: Averages were made of ≥8 retinas of transgenic mice at 4 and 16 weeks of age. B, D: The histograms are the average ONL thickness at both age groups.
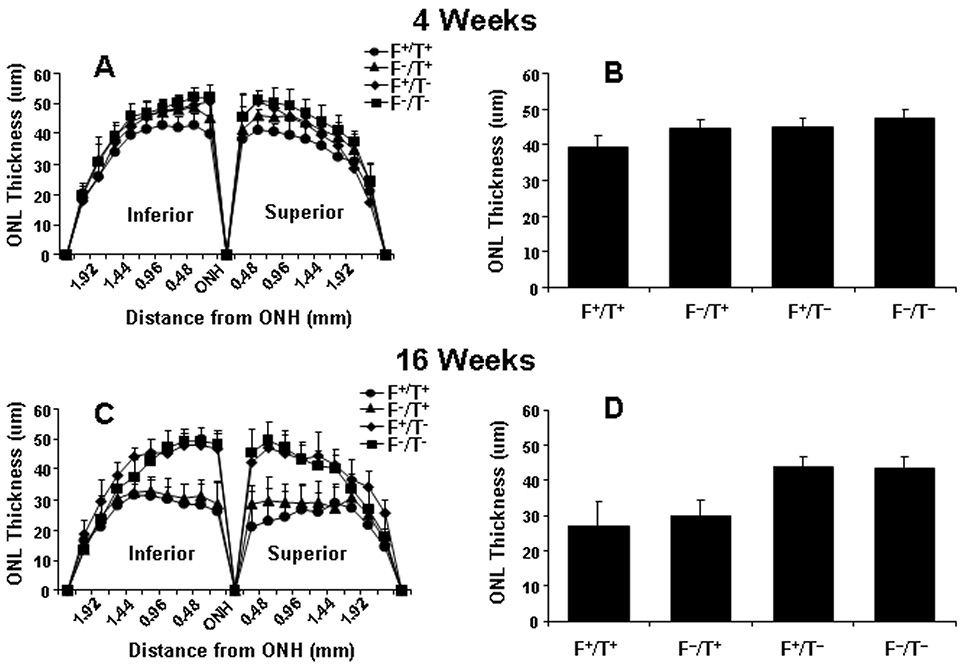
 Figure 5 of
Li, Mol Vis 2009; 15:1185-1193.
Figure 5 of
Li, Mol Vis 2009; 15:1185-1193.