Figure 2. Liver fatty acid composition.
Relative mole percentage (±SD) of n3 and n6 polyunsaturated fatty acids
are from total phospholipids of plasma of Fat1+/TG2+, Fat1–/TG2+,
Fat1+/TG2–, and Fat1–/TG2– mice at age of 4 weeks (A; n=4–5) and
16 weeks (B; n=4–7). Single (*), double (**), and triple (***)
asterisks indicate p<0.05, p<0.01, and p<0.001 for fat-1
positive versus fat-1 negative values Single asterisk (*)
indicates a p<0.05 fat-1 positive versus fat-1
negative. Double asterisk (**) represents a p<0.01 fat-1
positive versus fat-1 negative. Triple asterisk (***)
indicates a p<0.001 fat-1 positive versus fat-1
negative.
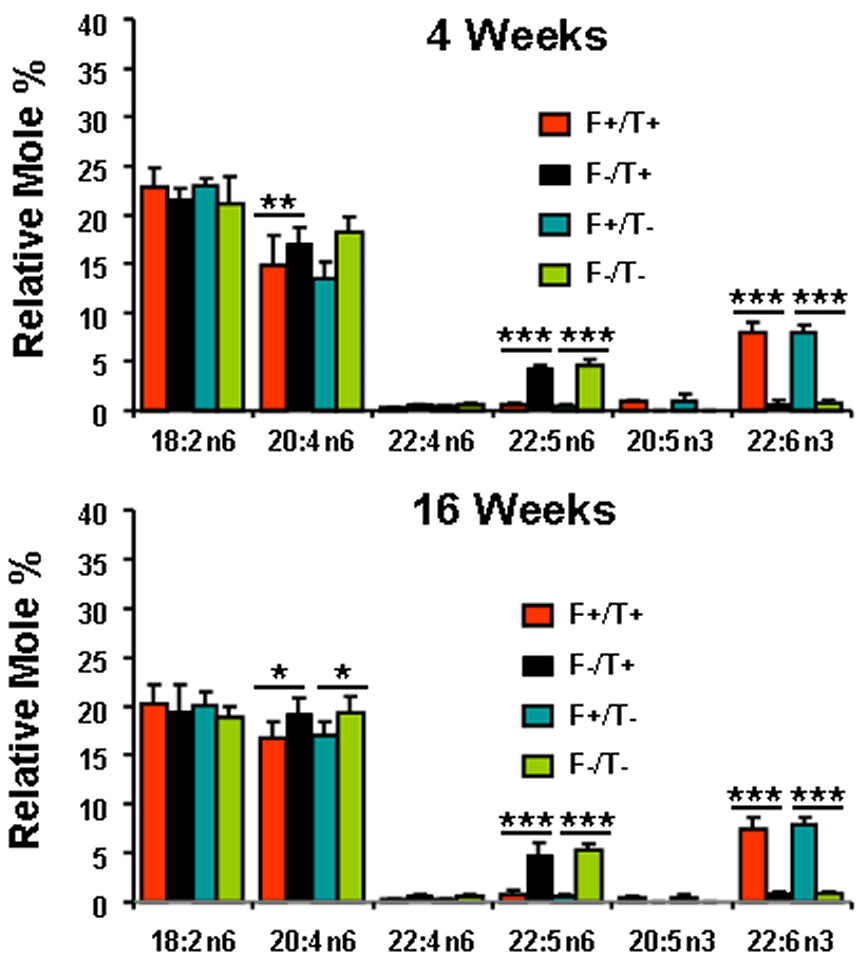
 Figure 2 of Li, Mol Vis 2009; 15:1185-1193.