Figure 2. P2Y2-R immunostaining
of transfected cells and treated corneas. A: SIRC cells were
incubated for 72 h with transfection reagent alone (control) or with P2Y2-R
siRNA #2 and then processed for ICC (40X magnification). B: The
chart shows P2Y2-R staining intensity quantification of
control and P2Y2-R siRNA transfected cells 72 h
post-transfection. C: A series of micrographs shows the P2Y2-R
signal in corneas treated with 0.9% saline, 100 μM Ap4A, and
siRNA+100 μM Ap4A while we can observed the nuclear staining
for DAPI in blue (40X). D: The graph shows the P2Y2-R
intensity signal in the three different treatments at 24 h and 36 h
after wounding. Three asterisks mean p<0.001 when compared to the
control. Green fluorescence (FITC) localizes P2Y2-R.
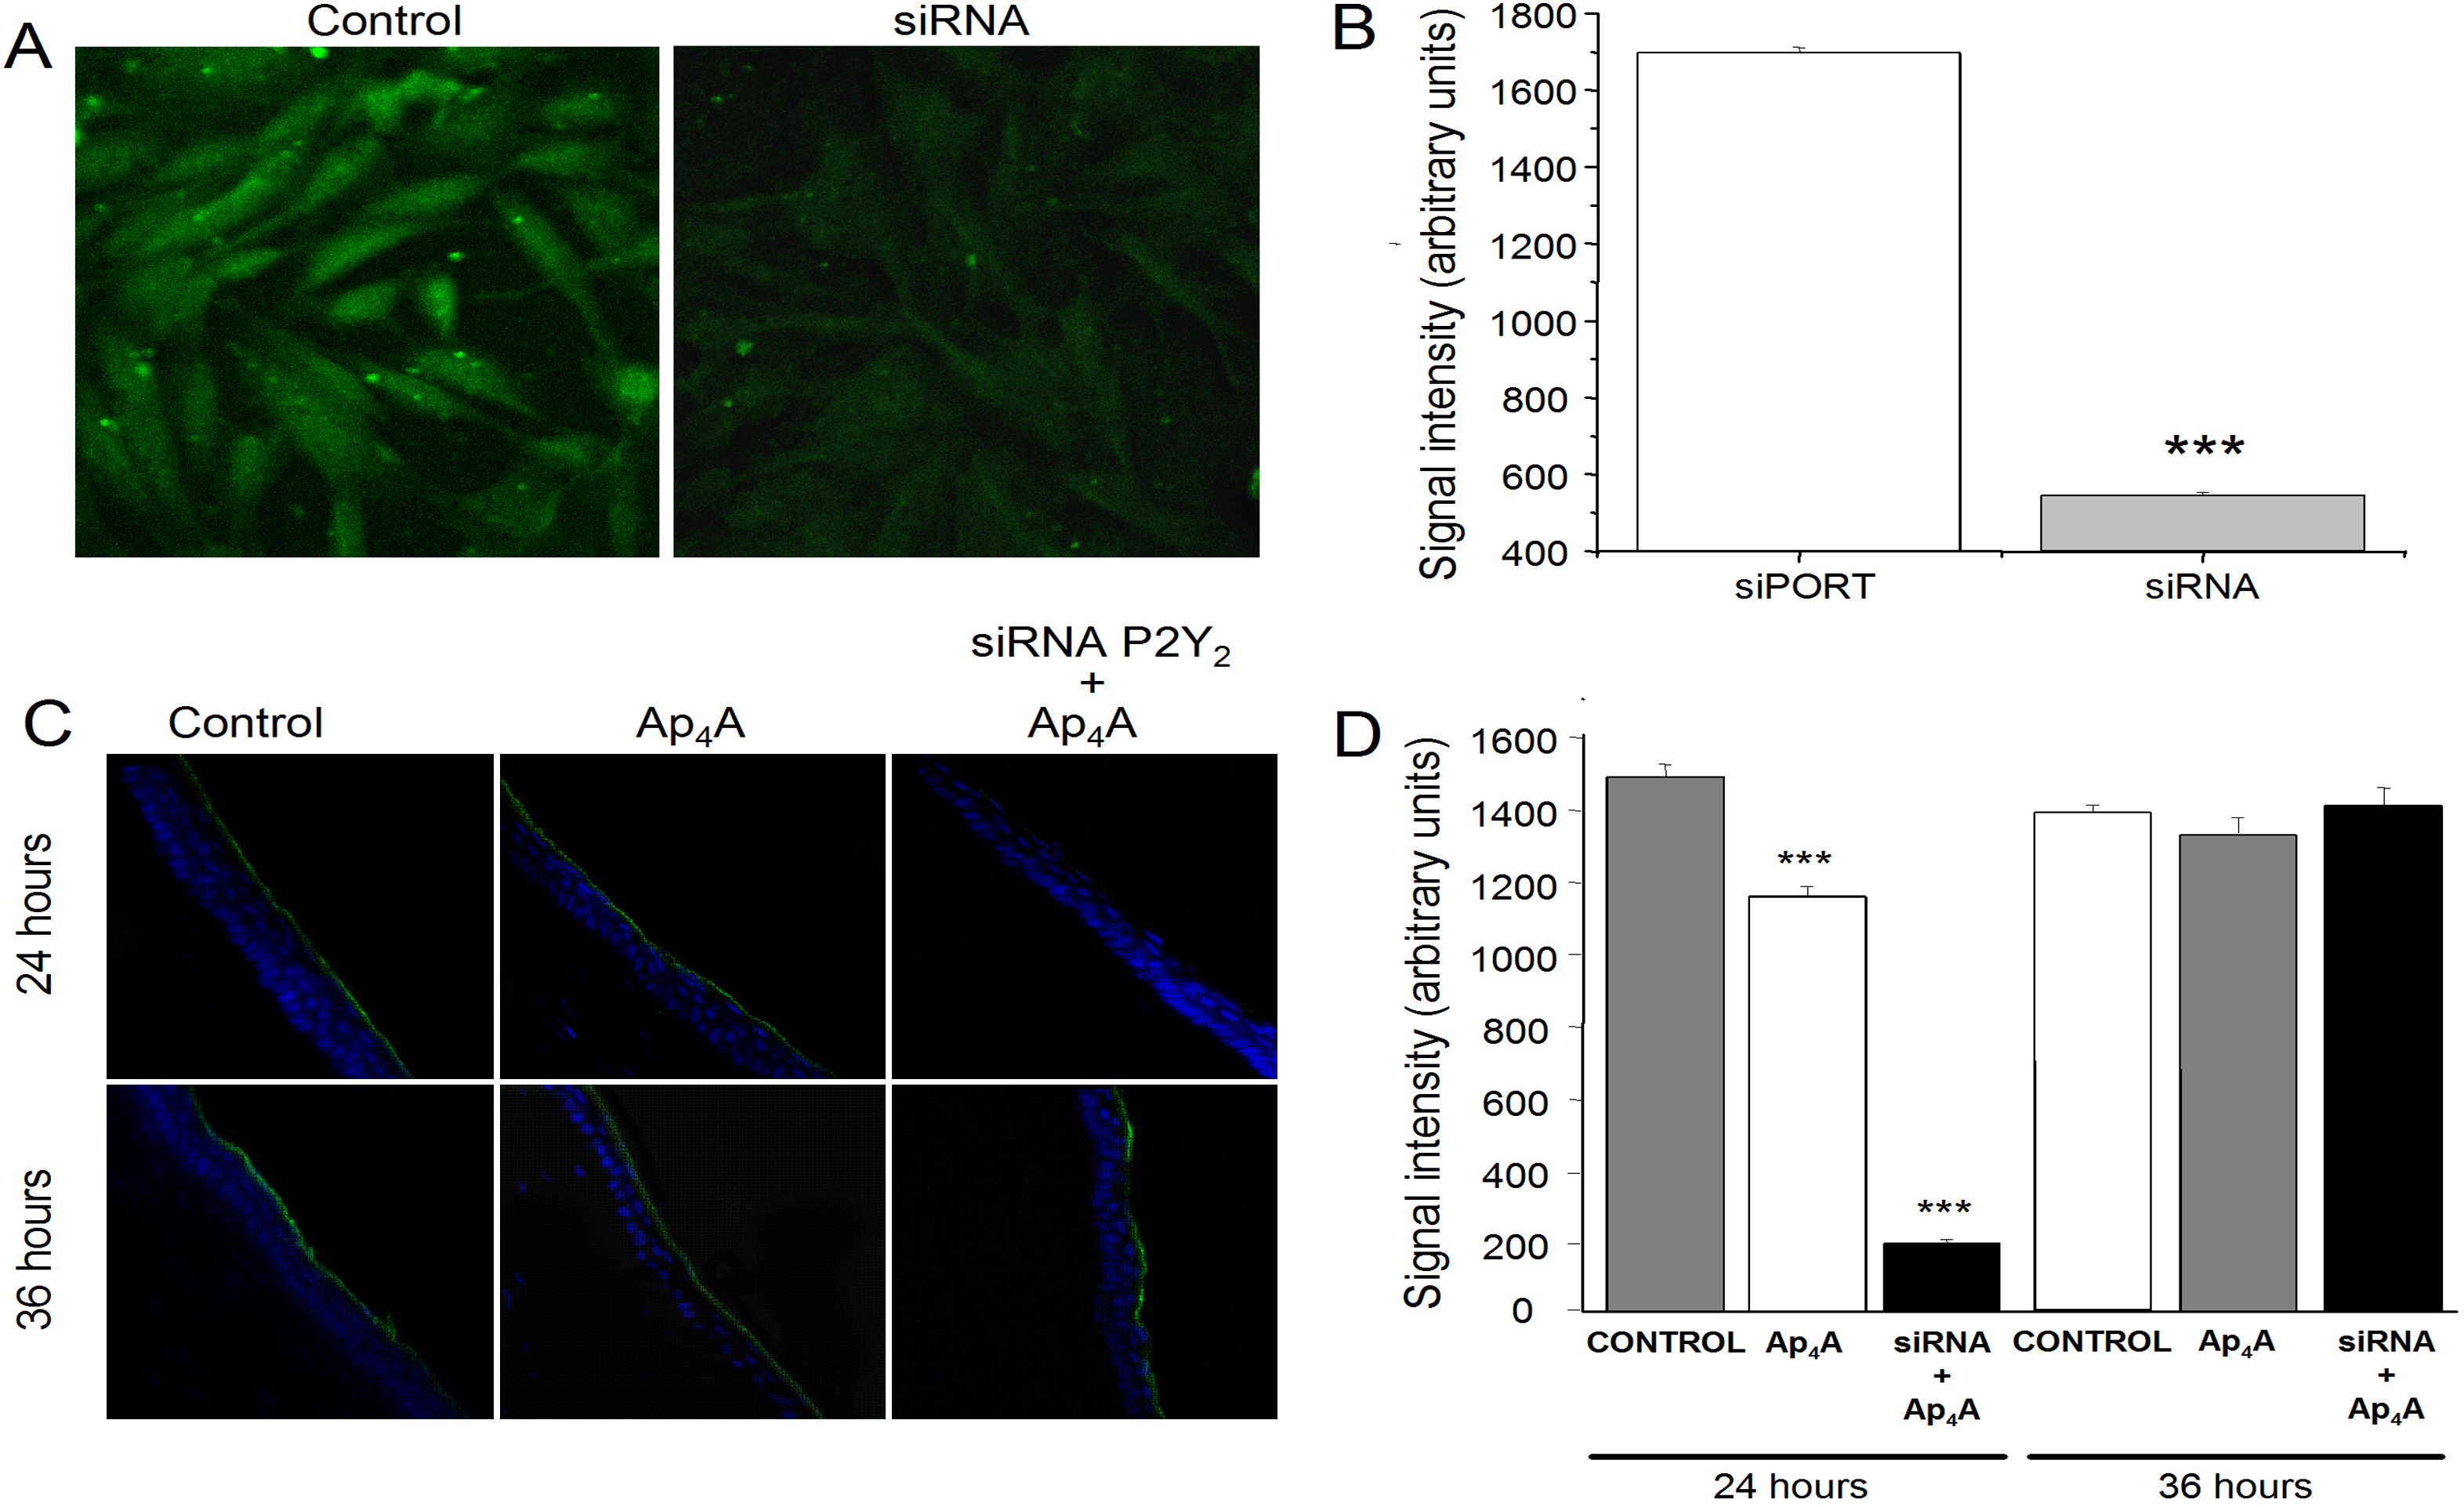
 Figure 2 of Crooke, Mol Vis 2009; 15:1169-1178.