Figure 5. Differential temporal changes in
[Ca2+]i in HCECs exposed to PAF. A: The
pseudocolor ratio images of fura-2 loaded HCECs show time-dependent
changes of [Ca2+]i after 10 nM PAF treatment. PAF
was added at time 0. The spectrum on the right indicates a calculated
calcium concentration represented by each color. Note that [Ca2+]i
of cells #1 and #2 oscillated after an initial peak whereas cell #3
mainly had a sustained elevation of calcium concentration during the 15
min recording. B: Temporal changes in [Ca2+]i
in the HCECs exposed to 10 nM PAF are shown. PAF was administered at
time 0. The oscillatory nature of [Ca2+]i
mobilization is readily apparent in cell #1 and #2.
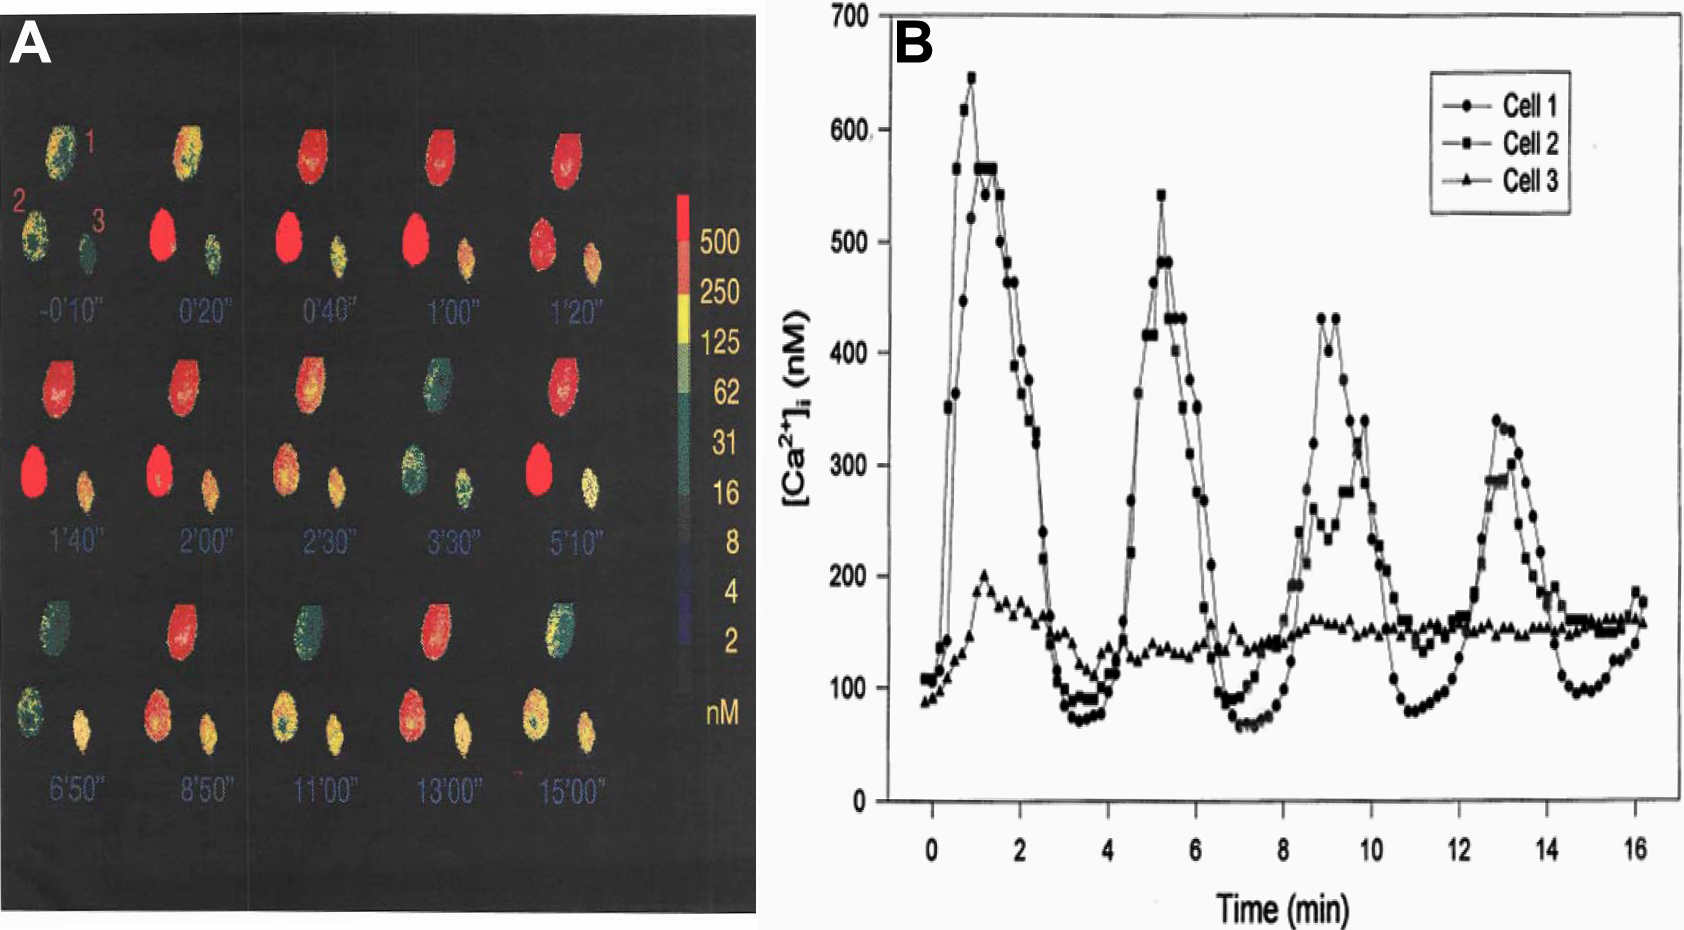
 Figure 5 of Sharif, Mol Vis 2009; 15:1153-1161.