Figure 4. Effect of a PAF antagonist, PCA, on PAF-stimulated [Ca2+]i mobilization in HCECs. Tracings of representative singe cells are shown. The y-axis shows the intensity ratio of fluorescence
at the two excitation wavelengths of a single cell. Higher ratio indicates higher [Ca2+]i. Additions of various compounds at various time points are indicated. A shows how pretreatment of HCECs with PCA (10 µM) blocked the PAF-induced effect. Similar results were obtained in a total
of 25 cells. B shows how the PAF-induced elevated [Ca2+]i was eliminated immediately upon the addition of PCA. Similar results were obtained in a total of 14 cells. C shows how the PAF-induced oscillation of [Ca2+]i mobilization was eliminated when PCA was added. Similar results were obtained in a total of seven cells.
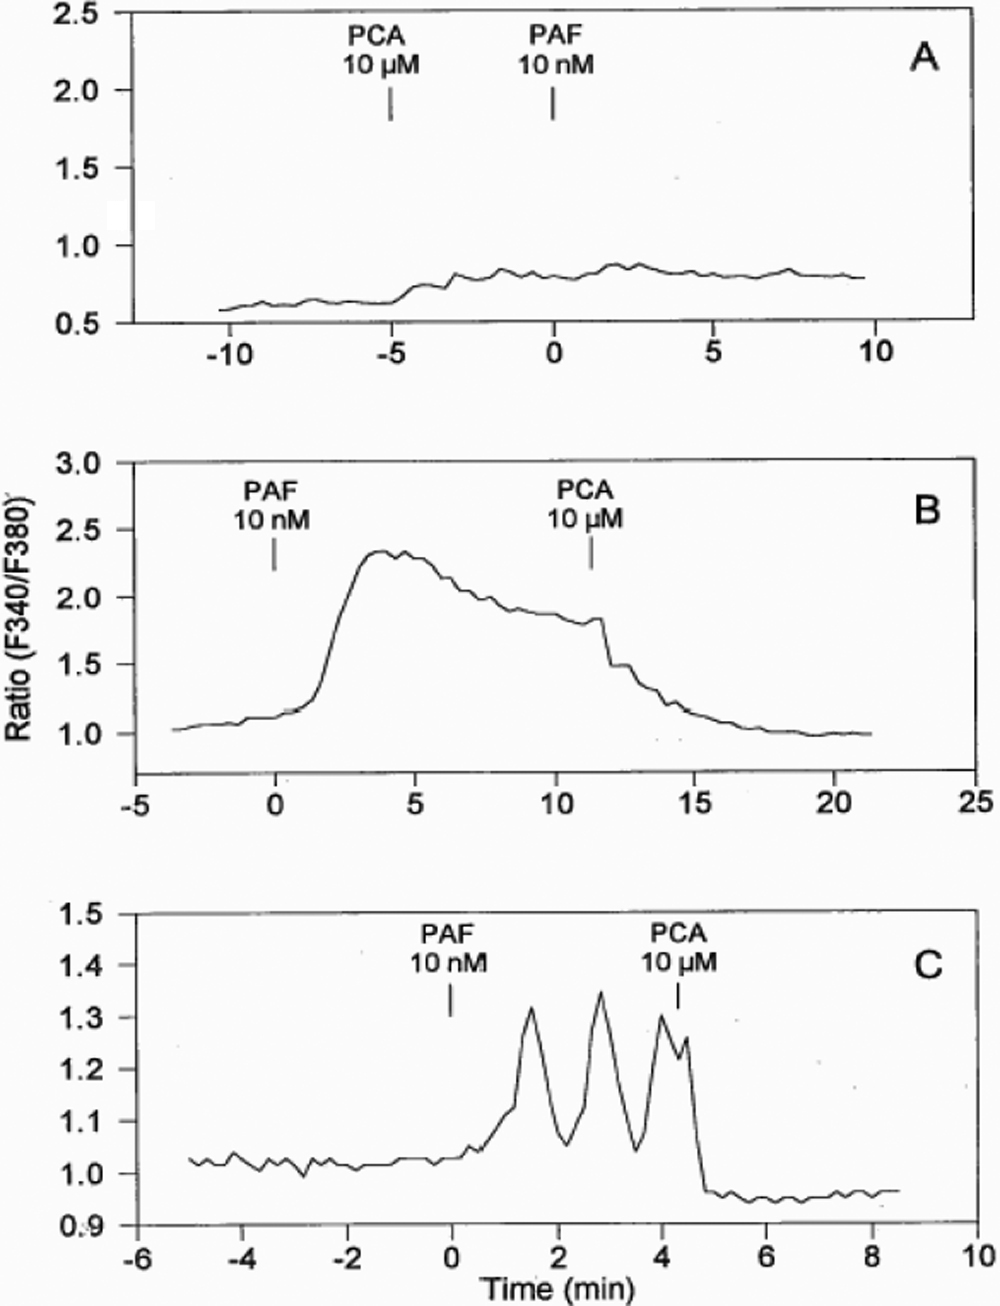
 Figure 4 of
Sharif, Mol Vis 2009; 15:1153-1161.
Figure 4 of
Sharif, Mol Vis 2009; 15:1153-1161.