Figure 3. Effects of PAF on [Ca2+]i in HCECs. A shows representative changes in [Ca2+]i of a single cell. B shows the effects of adding various concentrations of PAF to HCECs at different time points and the changes in [Ca2+]i. Wash=drug removal by rinsing the cells with 5 rinses of 2 ml each time with assay buffer. C shows the concentration-response curve for PAF obtained by plotting peak calcium responses after PAF treatment versus the
corresponding PAF concentrations. Resting intracellular calcium concentration defines 0% response and calcium concentration
after 100 nM PAF defines 100% maximum response. In C, each symbol (filled circle) represents the mean±SEM (n=6).
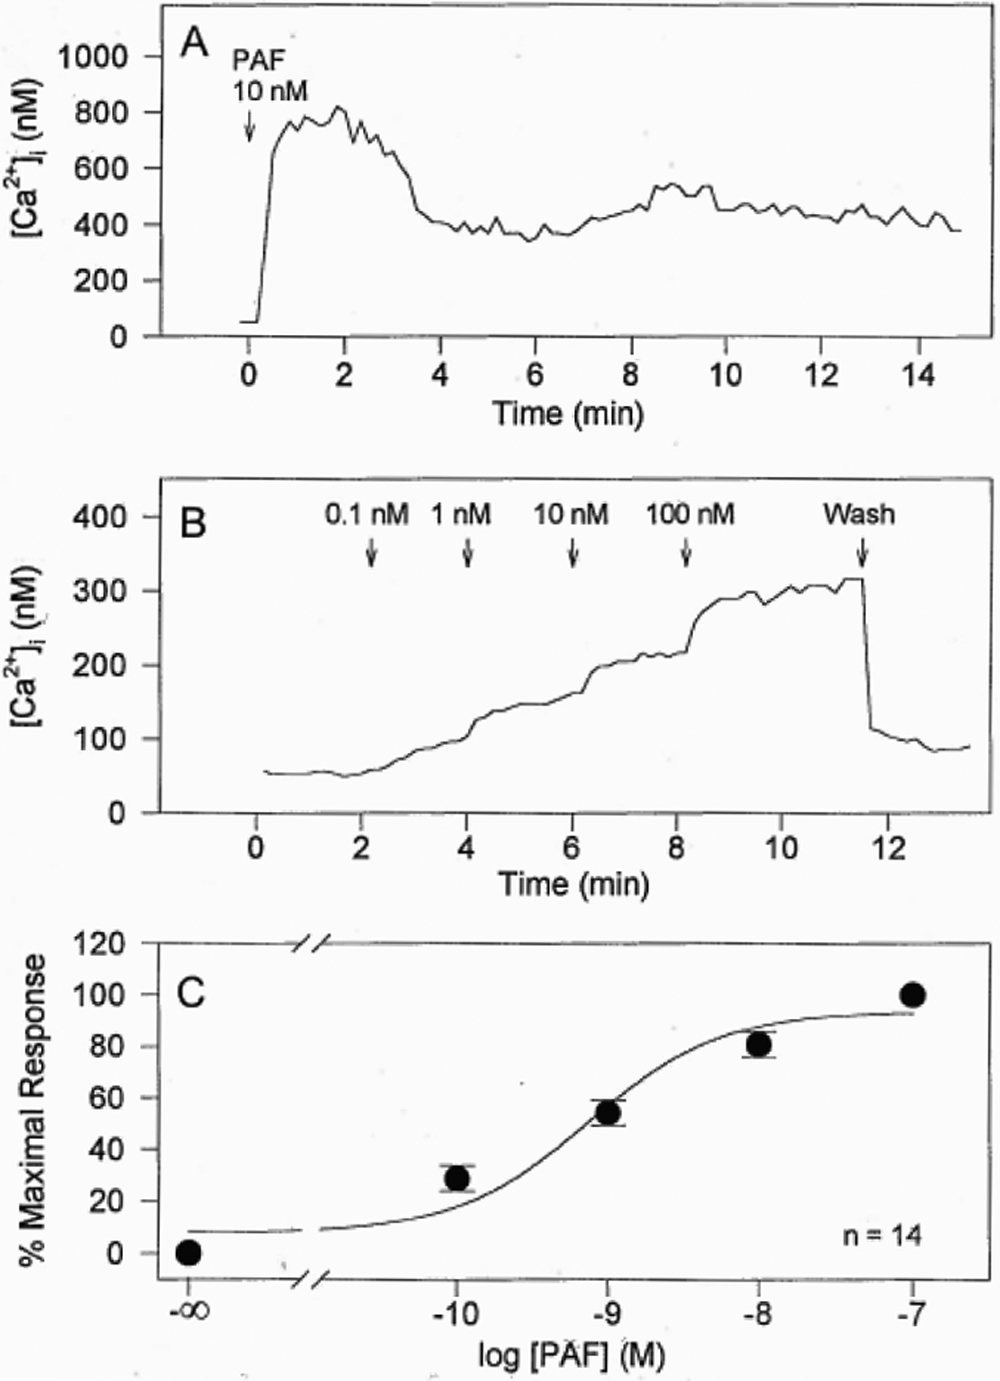
 Figure 3 of
Sharif, Mol Vis 2009; 15:1153-1161.
Figure 3 of
Sharif, Mol Vis 2009; 15:1153-1161.