Figure 4. Time-dependent expression of HSP70
and HSP90α. A: Time-dependent expression of HSP70
is shown of cells expressing WT or R12C CRYAA and cells transfected
with vector only. In WT CRYAA expressing cells, the HSP70
expression reached to a peak level 40 min after heat shock while in
R12C expressing cells, HSP70 expression showed a biphasic curve
and reached the highest level at 120 min. B: The HSP90α
expression remained constant among all time points in cells expressing
either WT or R12C CRYAA and in cells transfected with vector only.
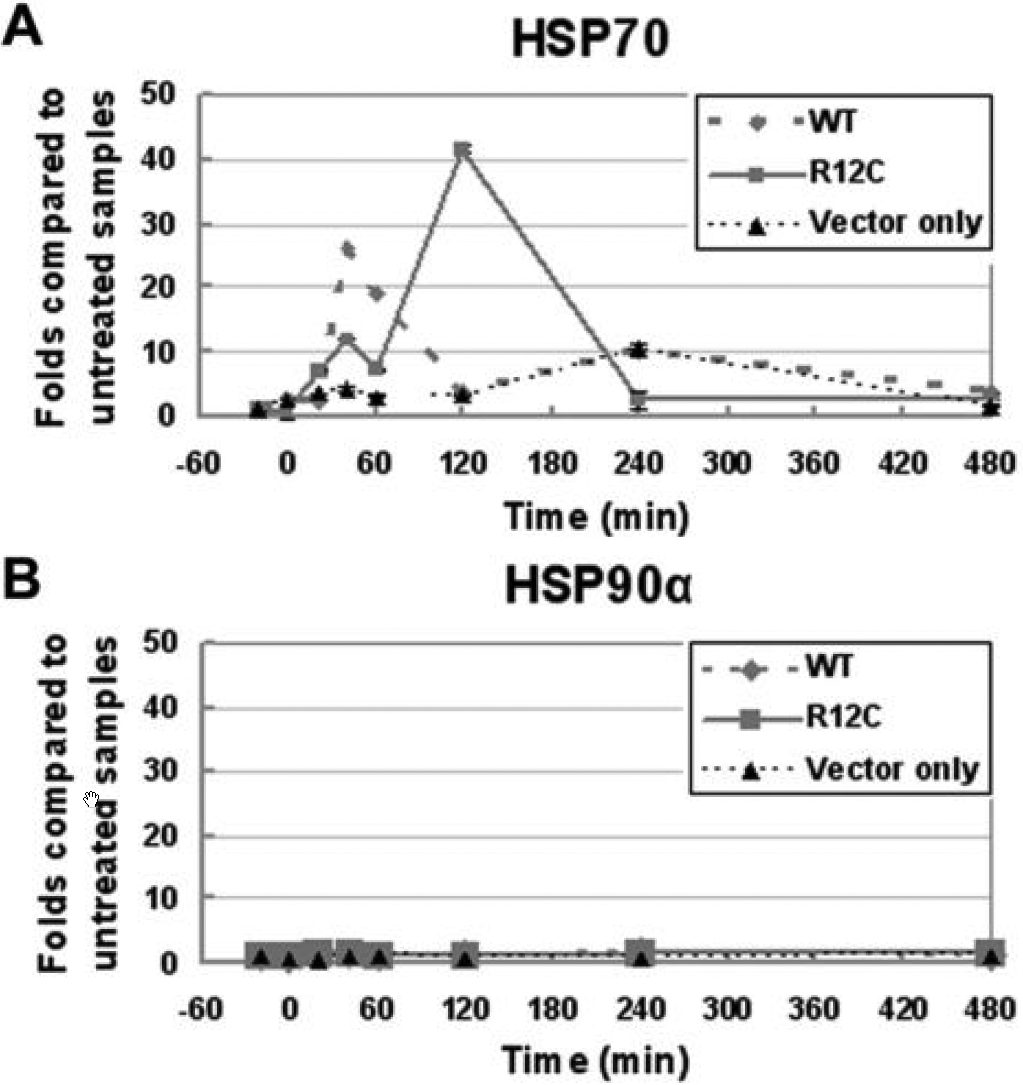
 Figure 4 of Zhang, Mol Vis 2009; 15:1127-1138.