Figure 3. R12C CRYAA protein features. A: Western blot analysis is shown of total CRYAA expression in transfected COS-7 cells lysed with RIPA. The total amount of
mutant R12C CRYAA expressed in COS-7 cells was similar to that of wild type (WT). “-” represents the CRYAA amount in cells
transfected with vector only. The expression of housekeeping GAPDH and β-actin is shown as reference. Band densitometry verified
that there was no significant difference between WT and R12C mutant amounts after being corrected by GAPDH expression. In
band densitometry, bars represent SD. B: Detergent solubility of WT and R12C mutant is analyzed. The amount of R12C in Tx-soluble fractions was similar to that of
WT. Only a trace of R12C mutant was detected in Tx-insoluble fractions. However, there was no significant difference between
WT and R12C mutant amounts after normalization by the housekeeping protein expression. C-F: The subcellular distribution of WT and R12C CRYAA in COS-7 cells is analyzed as well. The transient expression of recombinant
myc/His-tagged WT and R12C in COS-7 cells was detected by anti-CRYAA (C and E) and anti-myc antibodies (D and F), respectively. Both the WT (C,D) and mutant proteins (E,F) were predominantly localized in the cytoplasm. The red fluorescence indicates the expression of CRYAA, which was overlaid
with DAPI-stained nucleus in blue color. Scale bar: 50 µm.
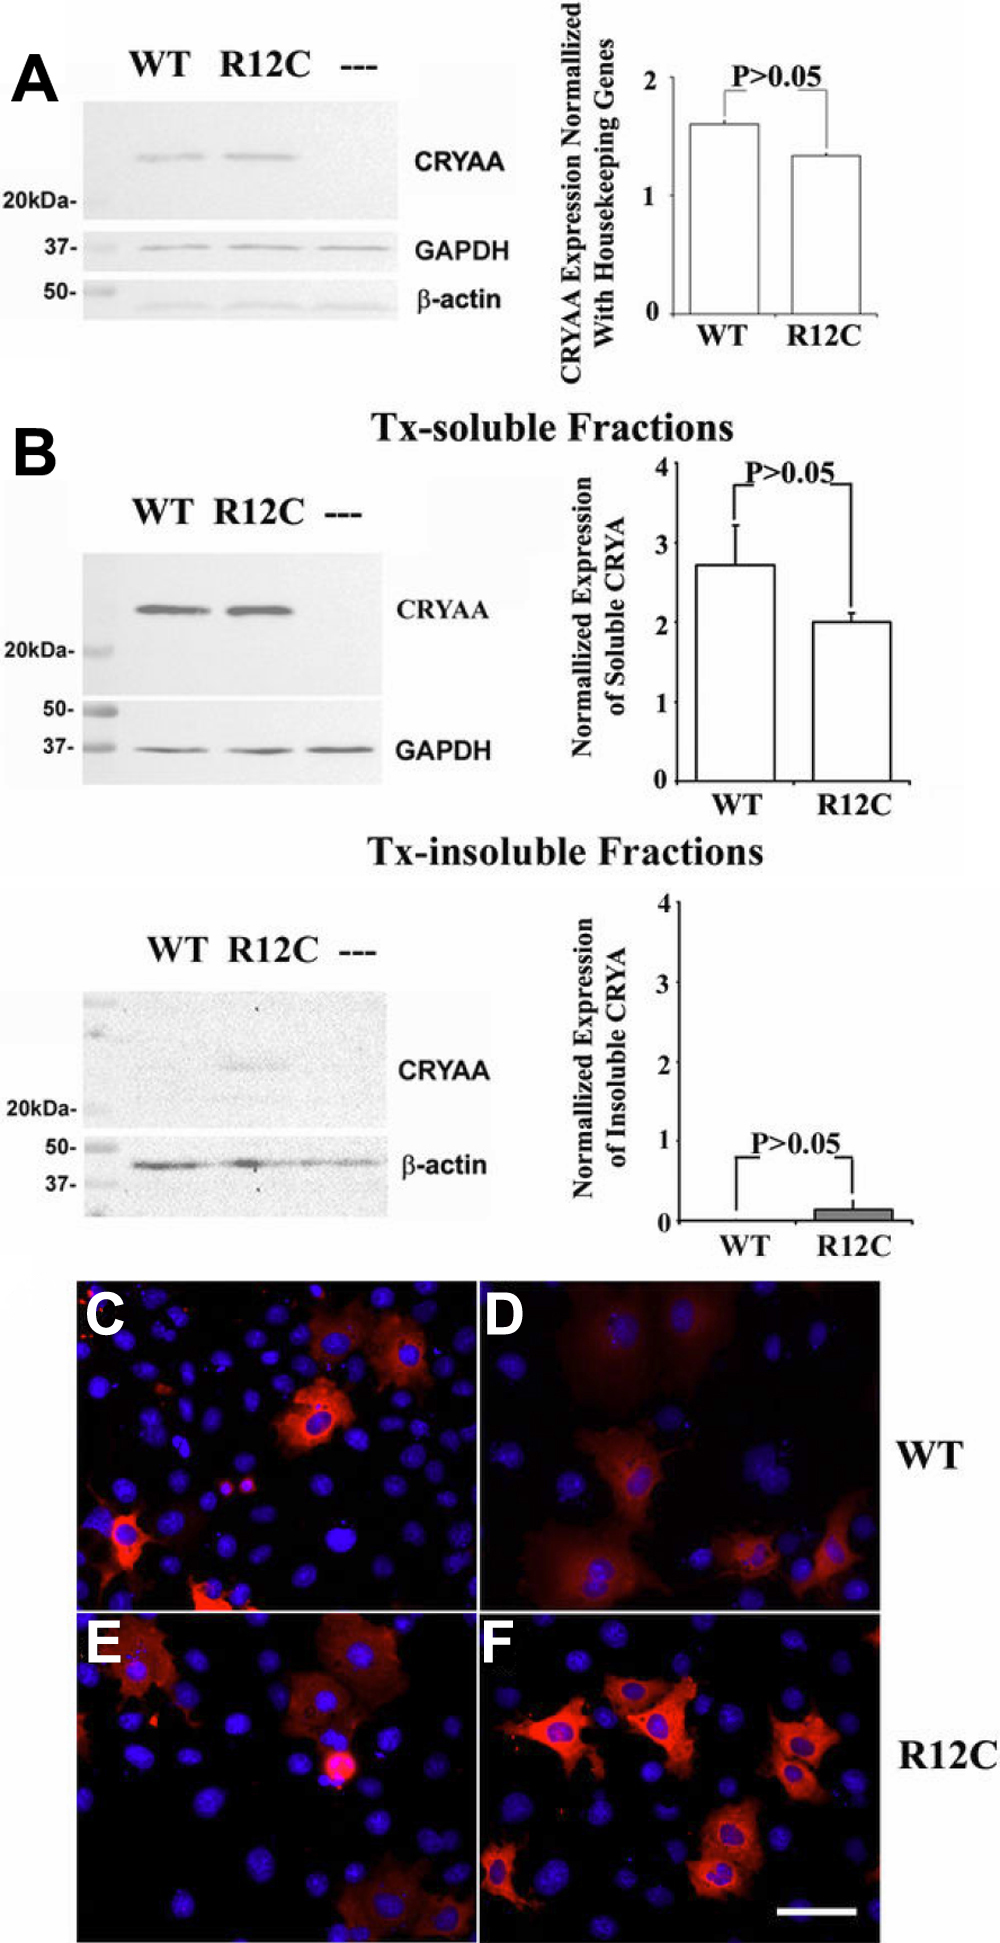
 Figure 3 of
Zhang, Mol Vis 2009; 15:1127-1138.
Figure 3 of
Zhang, Mol Vis 2009; 15:1127-1138.