Figure 4. Cytochrome C release following exposure to elevated hydrostatic pressure. Differentiated RGC-5 cells were exposed to elevated
hydrostatic pressure (30 mmHg) for 3 days and immunostained with cytochrome c antibody. Non-pressurized control cells show
a typical filamentous and fused mitochondrial network (A). However, pressure treatment resulted in dispersed cytochrome C immunoreactivity in the cytoplasm (B). Size bar represents 10 µm (A and B). To quantify the observation of cytochrome C release from mitochondria exposed to elevated hydrostatic pressure, the percentage
of cells with completely released cytochrome C in the cytoplasm was determined (C). Mitochondria were separated from cytosol by differential centrifugation and cytochrome C content was analyzed. Three protein
samples from three independent experiments were loaded for each group. The cytochrome C protein bands show the positions,
based on comparison with size standards, of the 15 kDa form of cytochrome C in cytosolic and mitochondrial fraction. The blot
was stripped and reprobed with anti-actin antibody (~42 kDa) for cytosol fraction and anti-VDAC antibody (~31 kDa) for mitochondria
fraction to confirm similar protein loading in each lane (D). Relative intensity of chemiluminescence for each protein band was normalized using actin as cytosolic fraction calibrator
and VDAC as mitochondrial fraction calibrator (E). Data represent the means±SD of three independent experiments.
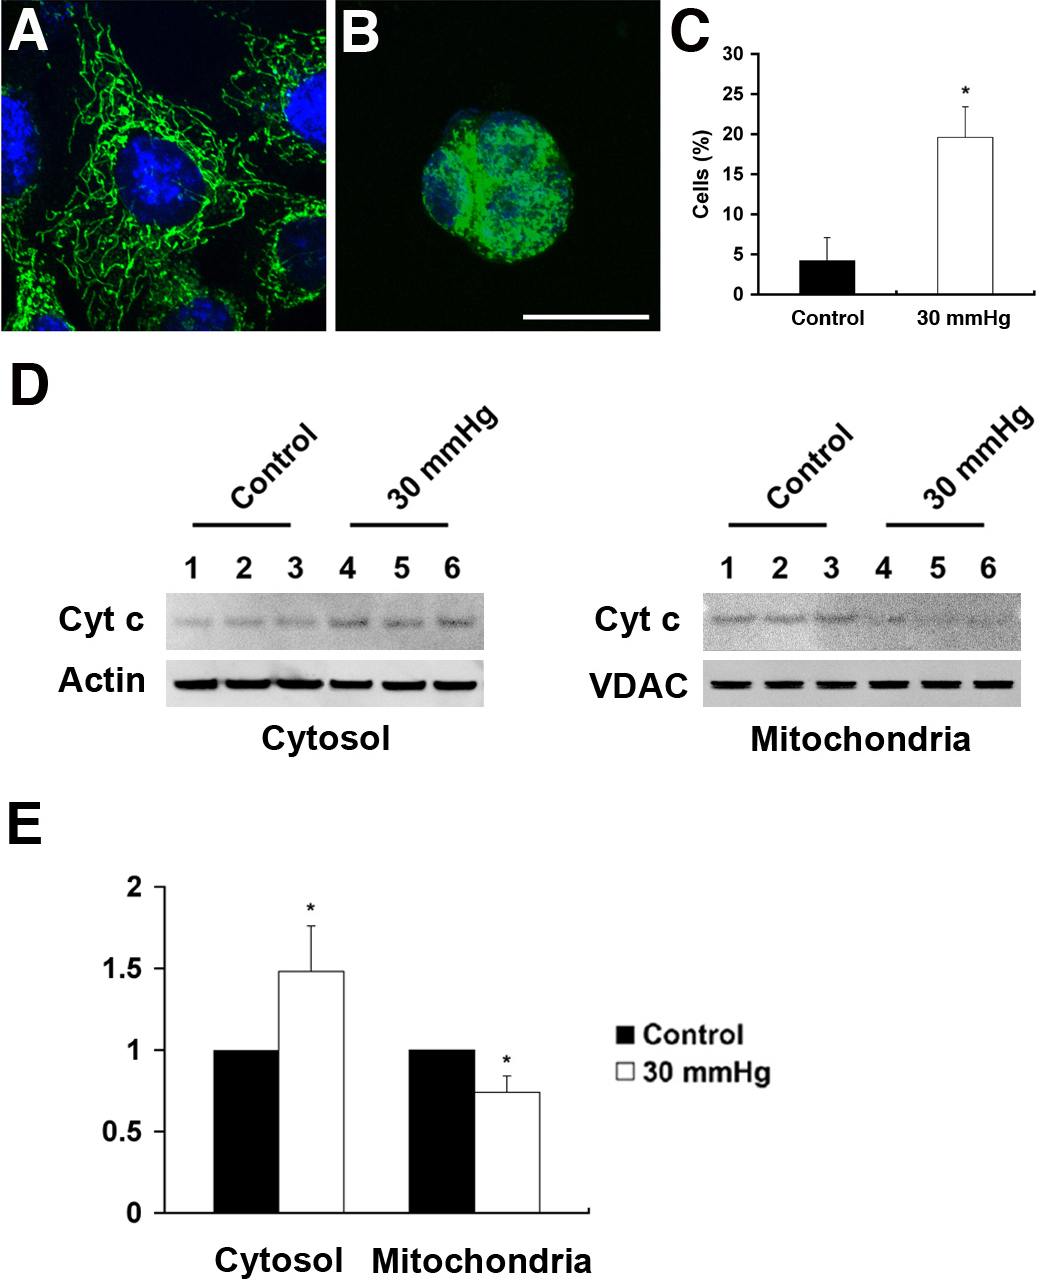
 Figure 4 of
Ju, Mol Vis 2009; 15:120-134.
Figure 4 of
Ju, Mol Vis 2009; 15:120-134.