Figure 3. Alteration of OPA1 gene and protein expression following exposure to elevated hydrostatic pressure. Following exposure to 30 mmHg for 2 and
3 days, the level of OPA1 mRNA was measured with specific primers and probes for rat OPA1 and GAPDH using Taqman qPCR and the level of total OPA1 protein was also measured using western blot. OPA1 expression was significantly decreased in pressurized cells (A), compared control cells. However, OPA1 protein expression did not show a difference between control and pressure treated
cells (B). Three protein samples from three independent experiments were loaded for each group. The OPA1 protein bands show the positions,
based on comparison with size standards, of approximately the 80 (S) to 90 kDa (L) forms of OPA1. The blot was stripped and
reprobed with anti-actin antibody (~42 kDa) to confirm similar protein loading in each lane (B). Mitochondria were separated from cytosol by differential centrifugation and OPA1 content was analyzed by western blotting.
An 80 kDa isoform of OPA1 was observed in the cytosolic fraction whereas 80 and 90 kDa isoforms of OPA1 were observed in the
mitochondrial fraction (C). Relative intensity of chemiluminescence for each protein band was normalized using actin as cytosolic fraction calibrator
and VDAC as mitochondrial fraction calibrator. (D). The blot was stripped and reprobed with anti-actin antibody (~42 kDa) for cytosol fraction and anti-VDAC antibody (~31 kDa)
for mitochondria fraction to confirm similar protein loading in each lane using same gel and exposure. Data represent the
means±SD of three independent experiments.
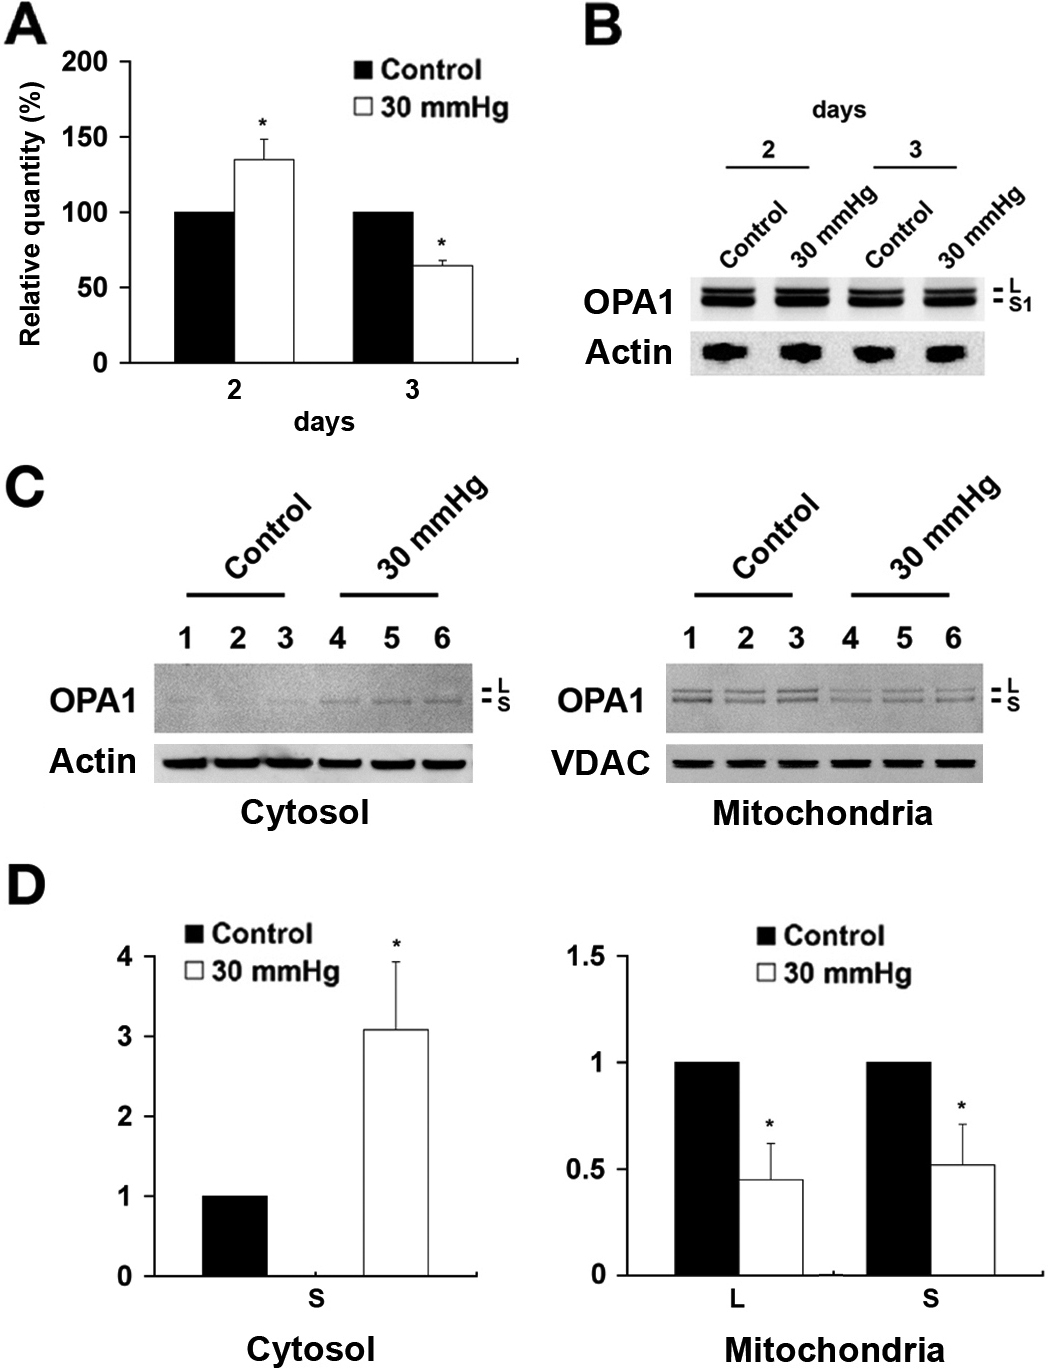
 Figure 3 of
Ju, Mol Vis 2009; 15:120-134.
Figure 3 of
Ju, Mol Vis 2009; 15:120-134.