Figure 1. Mitochondrial fission and loss of cristae following exposure to elevated hydrostatic pressure. Differentiated RGC-5 cells
were exposed to elevated hydrostatic pressure (30 mmHg) for 3 days and stained with MitoTracker Red. Non-pressurized control
cells show a typical filamentous and fused mitochondrial network (A). Pressurized cells show mitochondrial fission, which is characterized by the conversion of tubular fused mitochondria into
isolated small organelles (B). Electron micrographs of thin sections of RGC-5 cells show normal, elongated forms of mitochondria in non-pressurized control
cells (C), whereas elevated hydrostatic pressure produces smaller mitochondria (arrow) and mitochondria with abnormal, severe cristae
depletion (arrowheads; D). Closely apposed smaller mitochondria were also observed, such as the six shown in panel E, suggesting that fission had occurred. To quantify the observation of severe cristae depletion in the mitochondria exposed
to elevated hydrostatic pressure, the cristae density in tomographic volumes was determined after segmentation. This parameter
was calculated by dividing the sum of the cristae volumes by the mitochondrial volume for each mitochondrion (F). There were 13 control (from two experiments) and 14 pressurized mitochondria (from two experiments) fully segmented into
constituent compartments and analyzed (The asterisk indicates significance at p<0.001 compared to non-pressurized cells).
Data represent the means±SD. Size bar represents 20 µm (A and B) and 500 nm (C-E).
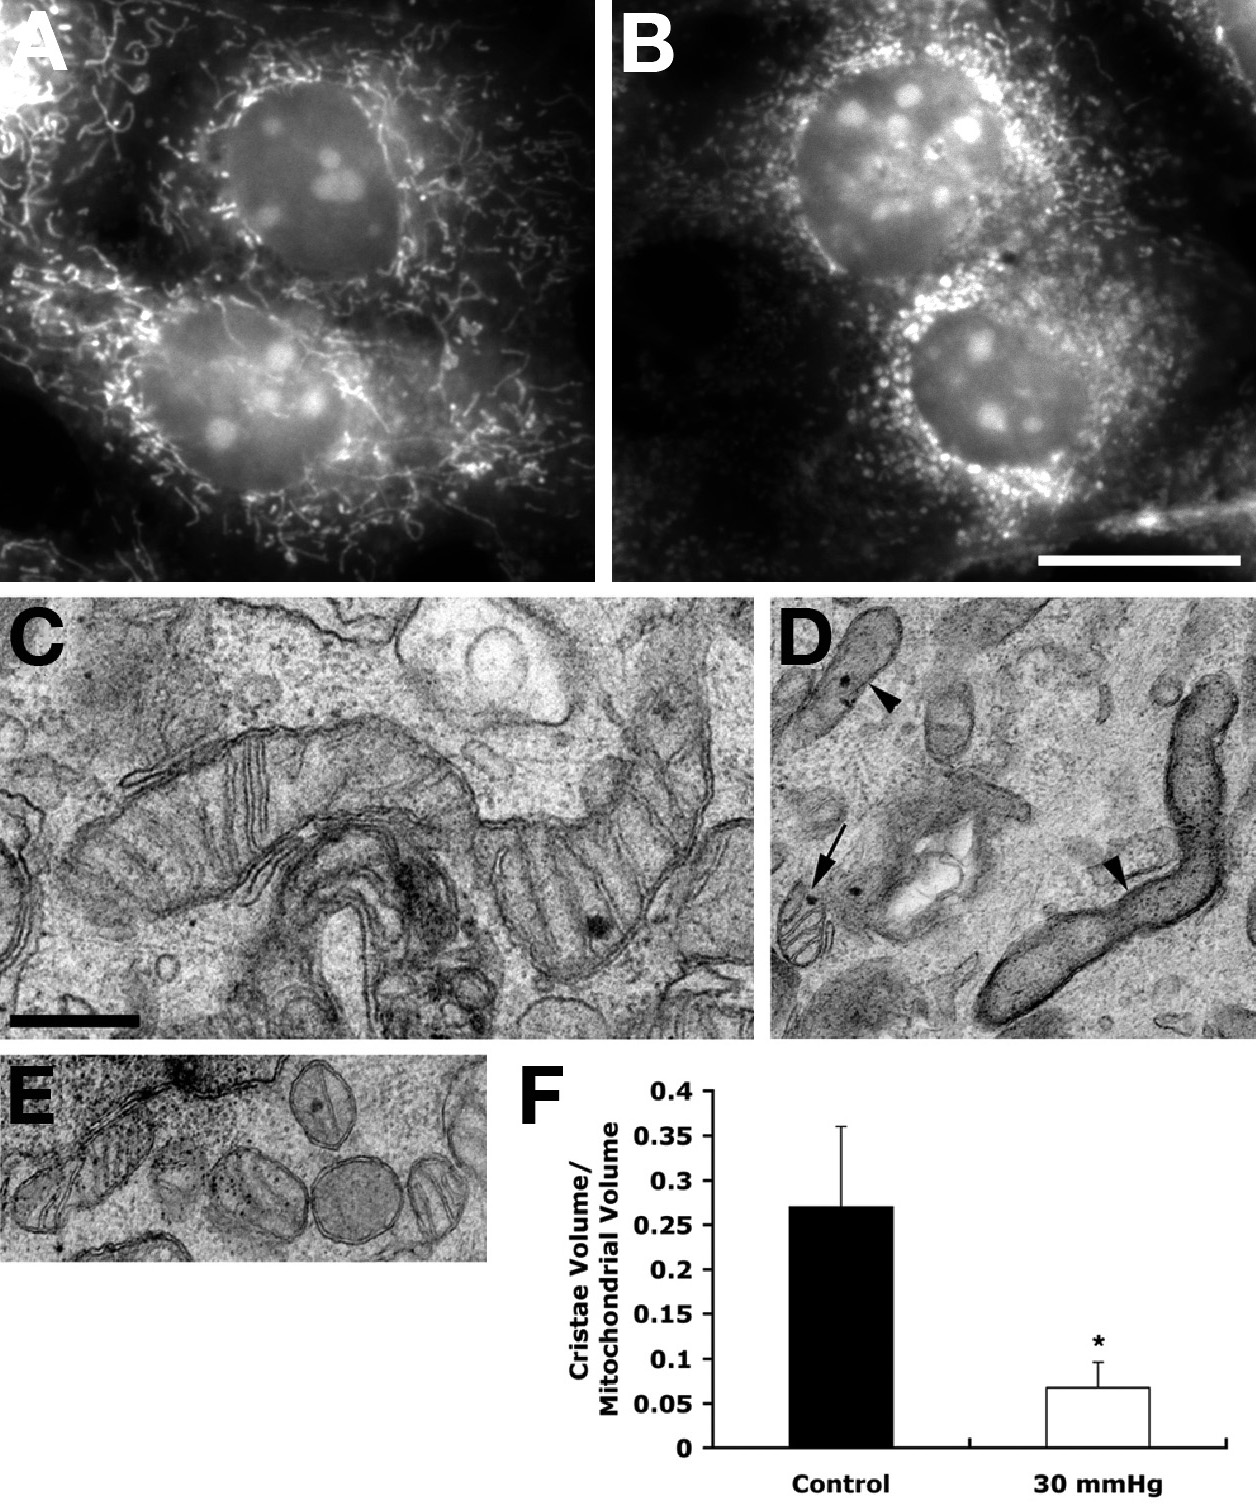
 Figure 1 of
Ju, Mol Vis 2009; 15:120-134.
Figure 1 of
Ju, Mol Vis 2009; 15:120-134.