Figure 1. En face near-infrared
reflectance and autofluorescence images of the LCA5 patients. A:
Near-infrared (NIR) reflectance (REF) image of the left fundus of P1 is
shown. Inset to the left is a schematic drawing of the retinal regions
corresponding to low reflection (black), intermediate reflection
(hatched), and high reflection and choroidal visibility (white). Inset
to the right is a NIR reflectance view of the fundus of a 6 year-old
child with normal vision. B: Near-infrared-autofluorescence
(NIR-AF) image of the left fundus of P1 is shown. Black arrows indicate
the boundaries of the midperipheral transitions to healthier retinal
pigment epithelium; and gray arrow points to the parafoveal annular
region of low intensity. Inset is a normal image. C: NIR
reflectance image of the left fundus of P2 is shown. Inset is an
enlarged view of the optic nerve head (ONH) region with ONH drusen. D:
NIR-AF image of the left fundus of P2 is shown. Inset is an enlarged
view of the ONH region. All images are shown contrast stretched for
visibility of features.
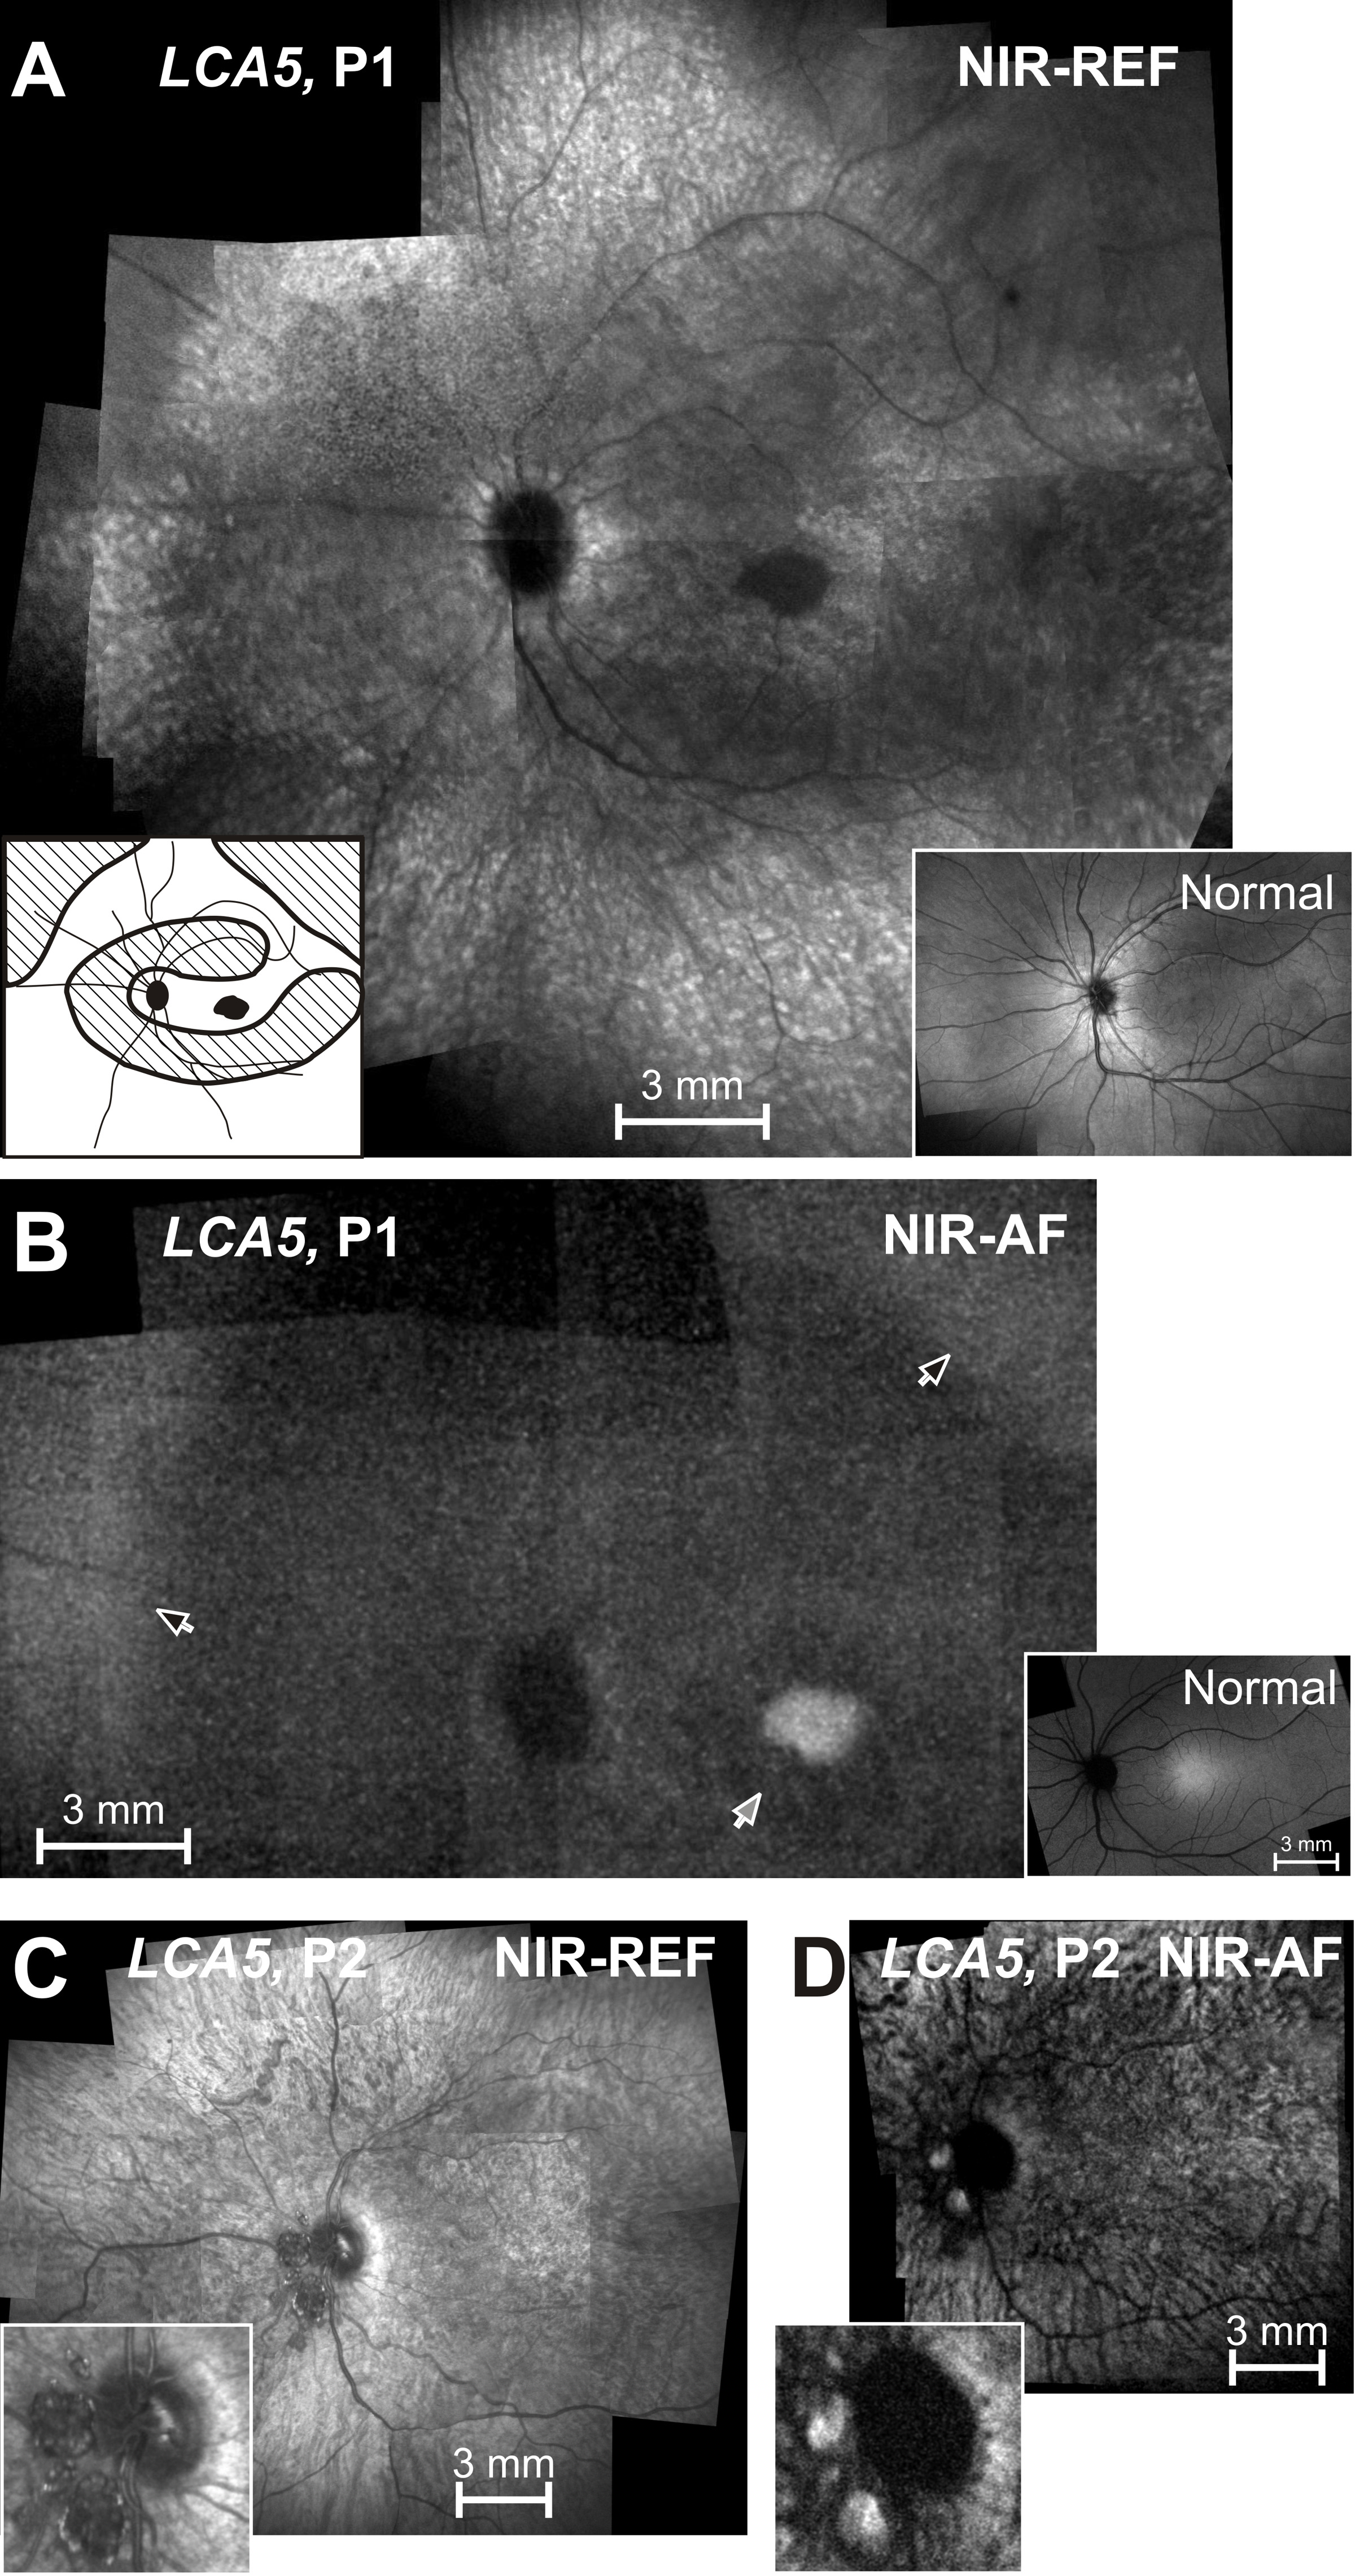
 Figure 1 of Jacobson, Mol Vis 2009; 15:1098-1106.