Figure 8. Effects of Robo4 on the
spreading of RF/6A and RPE cells. Cell spreading was quantified by
measuring the ratio of the cytoplasm area to the nuclear area in cells
in each field. A: Cell spreading of NS siRNA-treated RPE cells.
B: Cell spreading of Robo4 siRNA-treated RPE cells. C:
Cell spreading of NS siRNA-treated RF/6A cells. D: Cell
spreading of Robo4 siRNA-treated RF/6A cells. E: The
data of relative ratio of the cytoplasm area to the nuclear area in NS
and Robo4 siRNA group cells. Values are the means±SD of at
least three independent experiments. Asterisks denote values
significantly different from those of cells treated with Robo4
siRNA compared to NS siRNA (E, p<0.01). Abbreviations:
control siRNA-treated cells (NS); Robo4 siRNA-treated cells (R4
siRNA). The ratio of the NS group was set to 100%. Bar denote 100 μm.
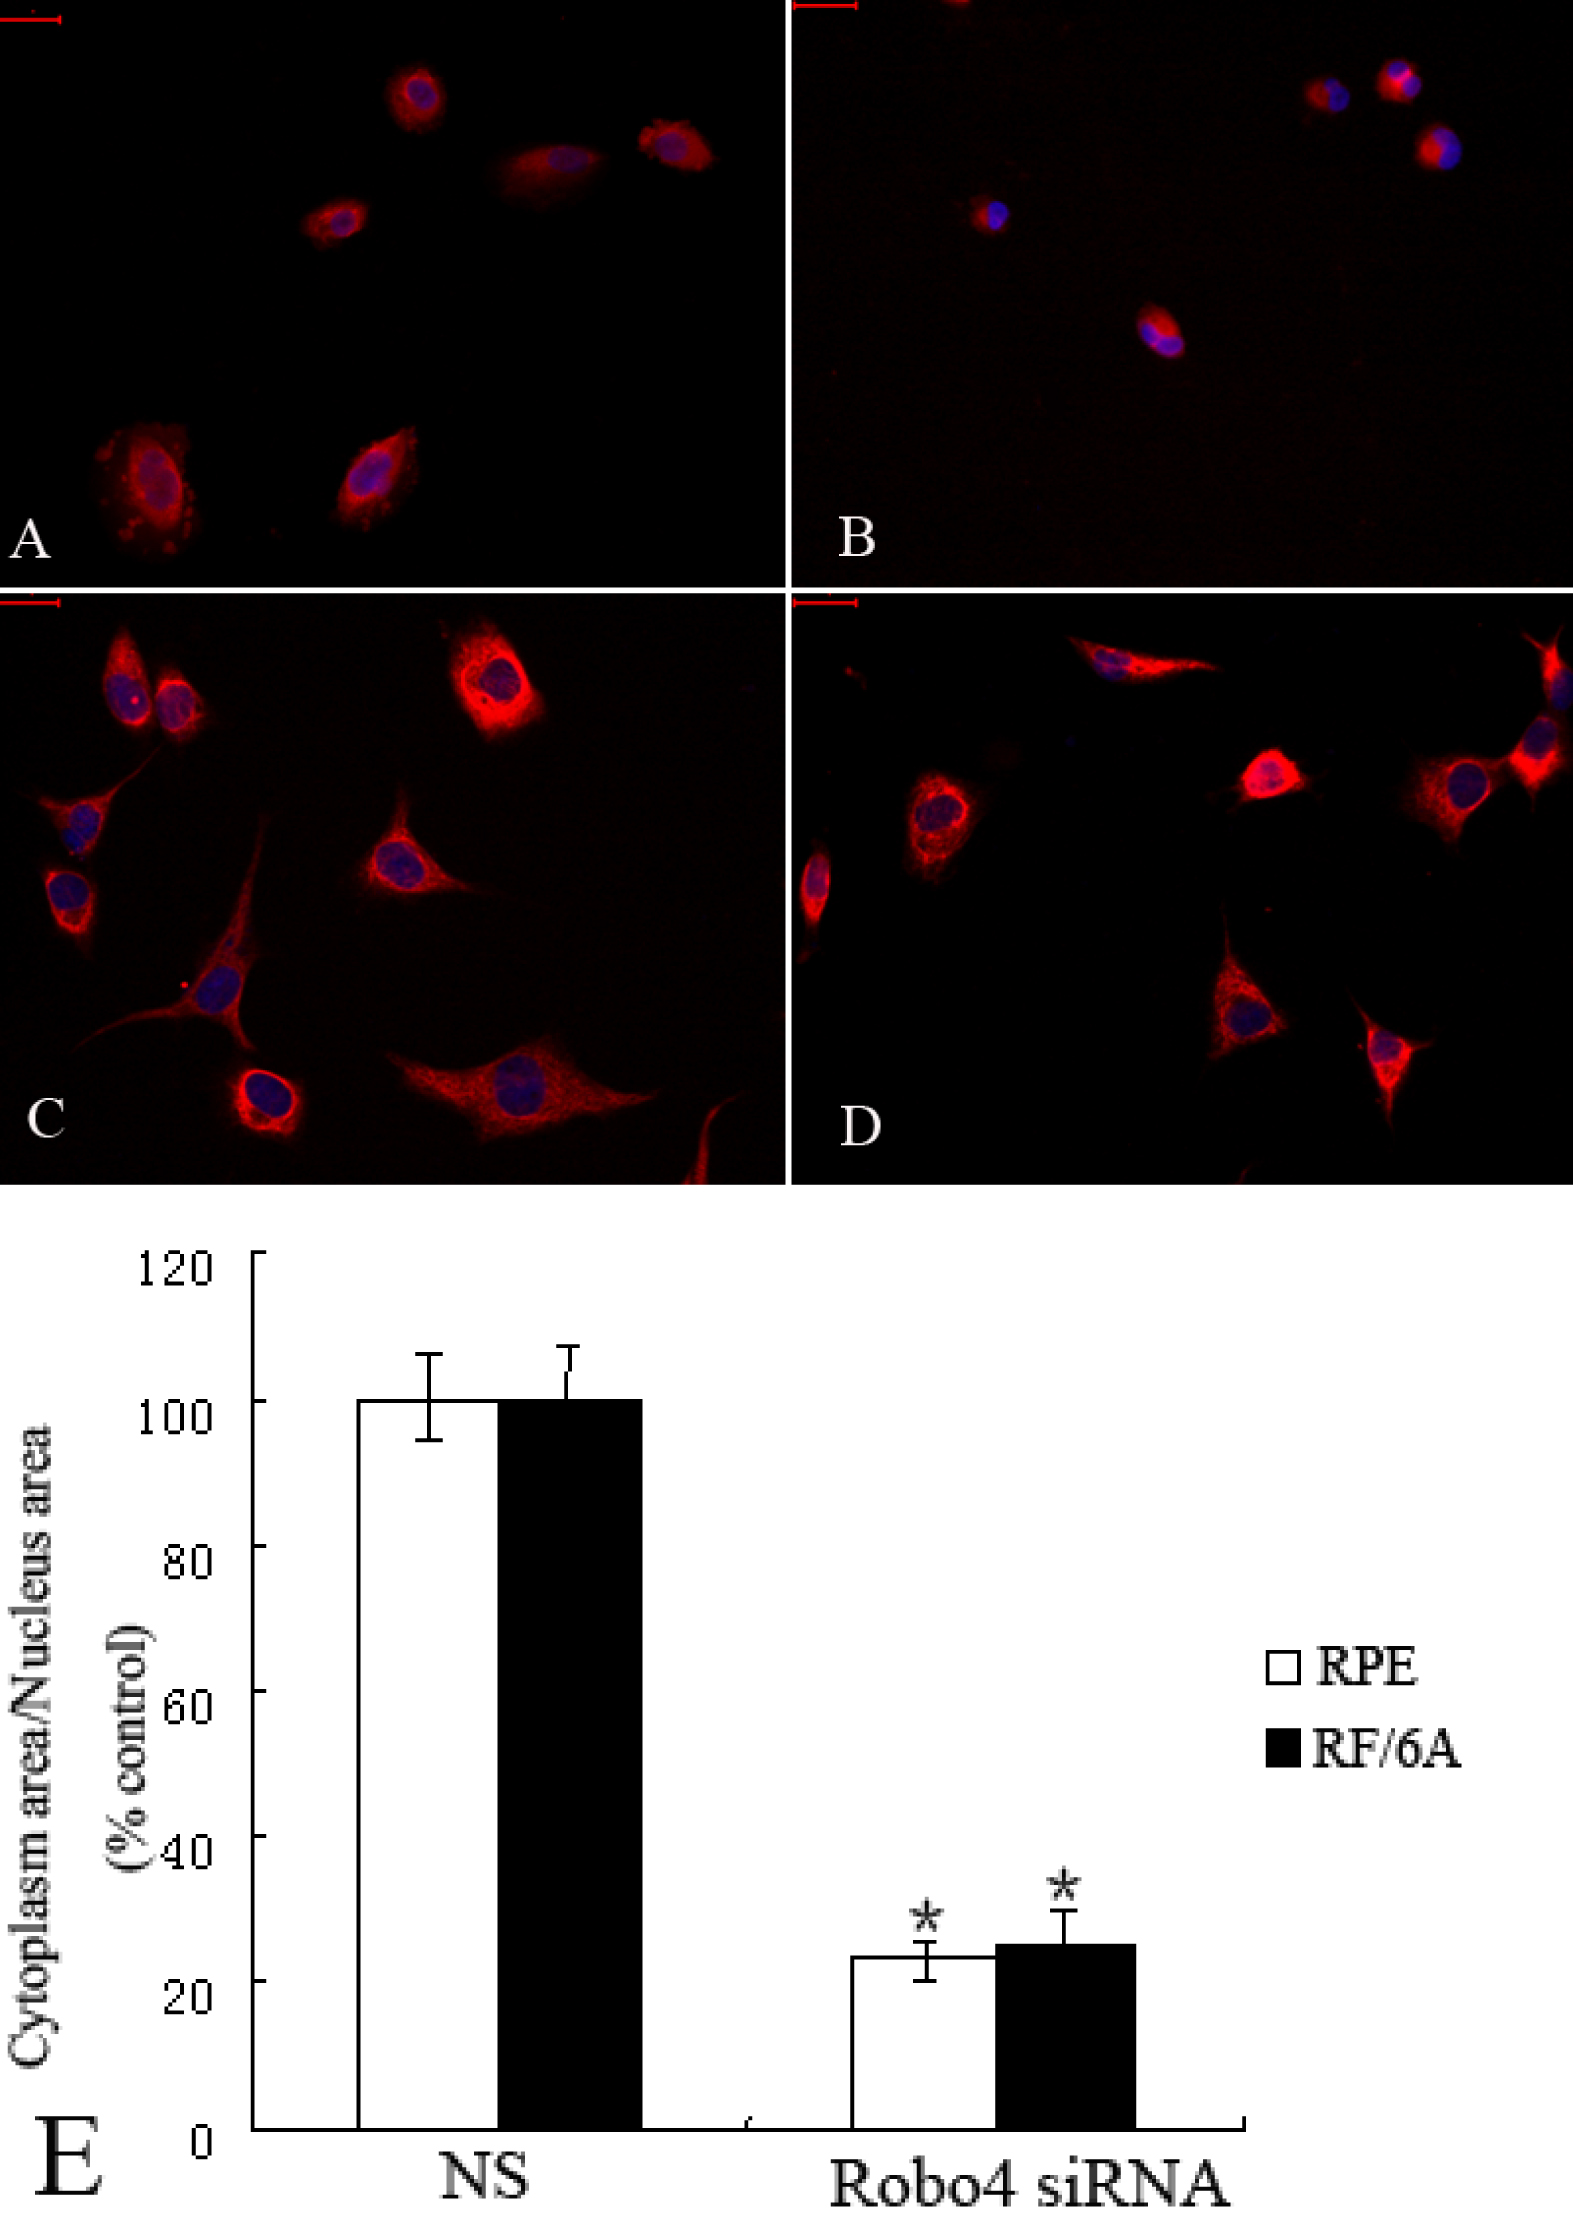
 Figure 8 of Huang, Mol Vis 2009; 15:1057-1069.