Figure 12. Effect of Robo4 on the cell
cycles of RF/6A and human RPE cells. A: Cell cycle of NS
siRNA-treated RPE cells. B: Cell cycle of Robo4
siRNA-treated RPE cells. C: Cell cycle of NS siRNA-treated
RF/6A cells. D: Cell cycle of Robo4 siRNA-treated RF/6A
cells. E: The data of RPE cell cycle distribution of NS and Robo4
siRNA group cells. F: was the data of RF/6A cell cycle distribution of
NS and Robo4 siRNA group cells. Flow cytometric analysis
demonstrated the effects of Robo4 on the cell cycle. The x-axis
represents the fluorescence intensity on a logarithmic scale and the
y-axis represents the number of events. The results show that the
fraction of G1-phase cells increased and the proportion of S-phase
cells decreased in the RF/6A and RPE cells after knockdown of Robo4.
Values are the means±SD of at least three independent experiments. The
proportion of G0/G1, G2, and S phase cells was decreased in Robo4
siRNA-treated RPE cells compared to NS siRNA-treated RPE cells (E,
*p<0.01). The proportion of G0/G1 and S phase cells was decreased in
Robo4 siRNA-treated RF/6A cells compared to NS siRNA-treated
RF/6A cells (F, *p<0.01). Abbreviations: control
siRNA-treated cells (NS); Robo4 siRNA-treated cells (R4 siRNA).
The cell cycle of NS was set to 100%.
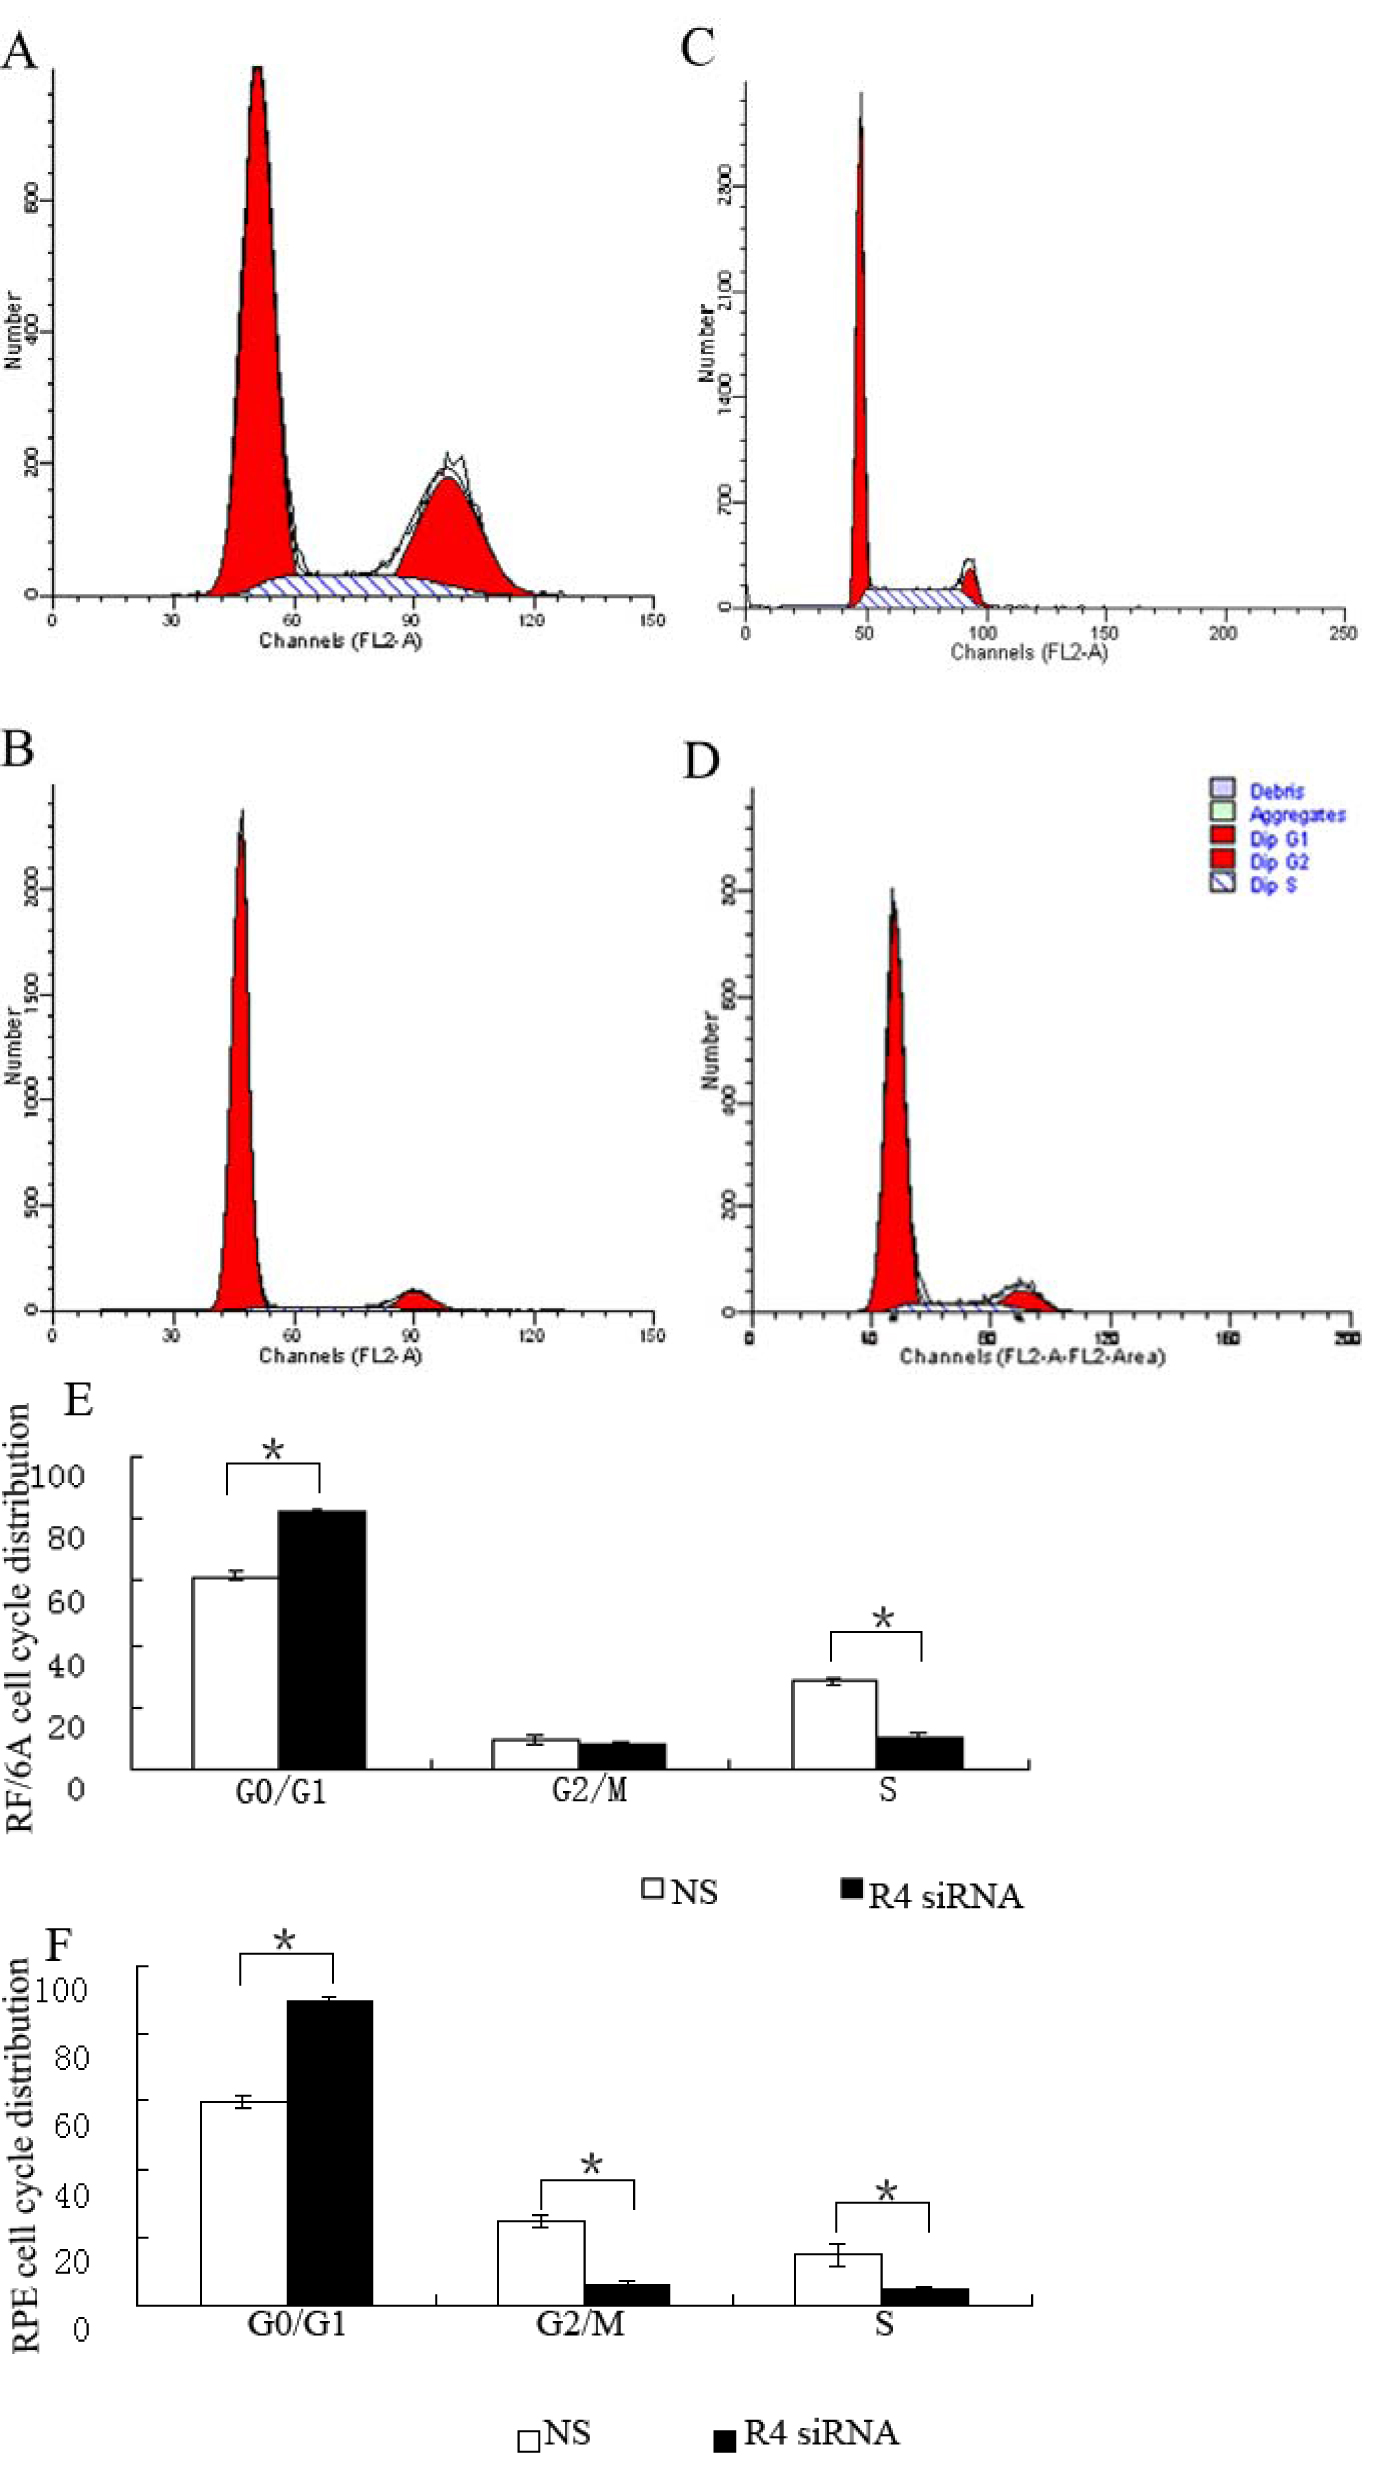
 Figure 12 of Huang, Mol Vis 2009; 15:1057-1069.