Figure 2. Effect of HIF-1α siRNA
on HIF-1α protein expression. Cells were transfected with 15 and 25 nM HIF-1α
siRNA and an siRNA non targeting control as indicated for 6 h.
Twenty-four hours after transfection, cells were exposed to 4 h of
hypoxia. Protein was collected immediately after treatment and blotted
for HIF-1α. Bar graph represents the band intensity relative to the
control. Error bars represent the standard error of the mean (n=3).
β-actin is detected as loading control.
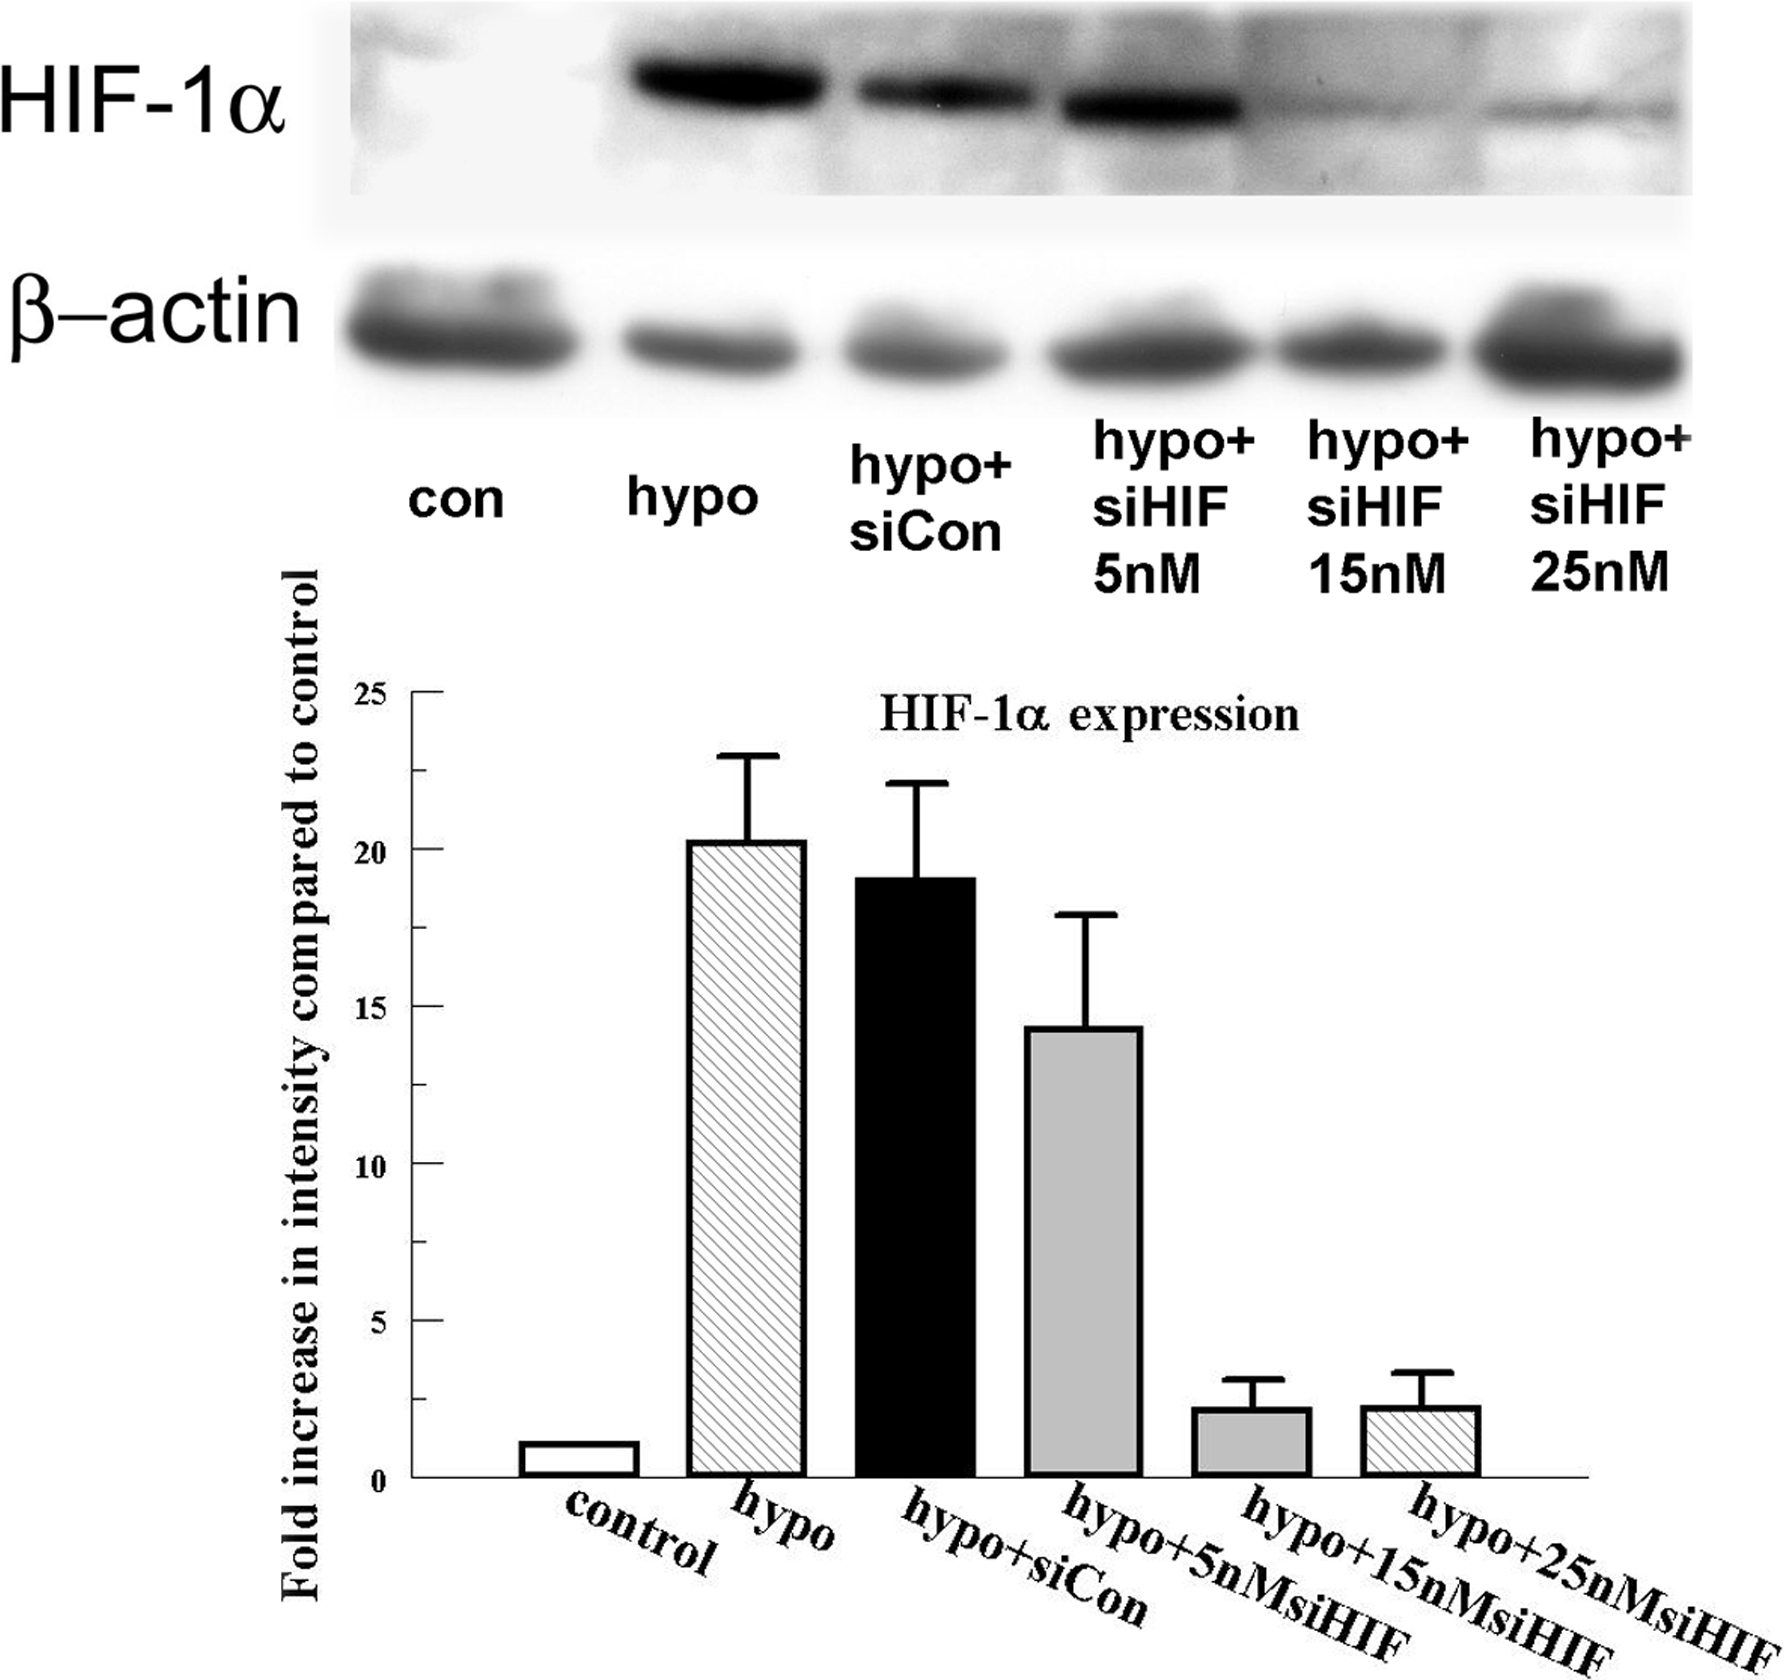
 Figure 2 of Xing, Mol Vis 2009; 15:1020-1027.