Figure 5. Flow cytometry analysis of the ratio of CK3+ cells in all groups. Data represent the mean±SE% of results in three replicate
experiments (The asterisk indicated a p<0.05, when compared with control data). There were no significant differences between Group A and Group B (p>0.05).
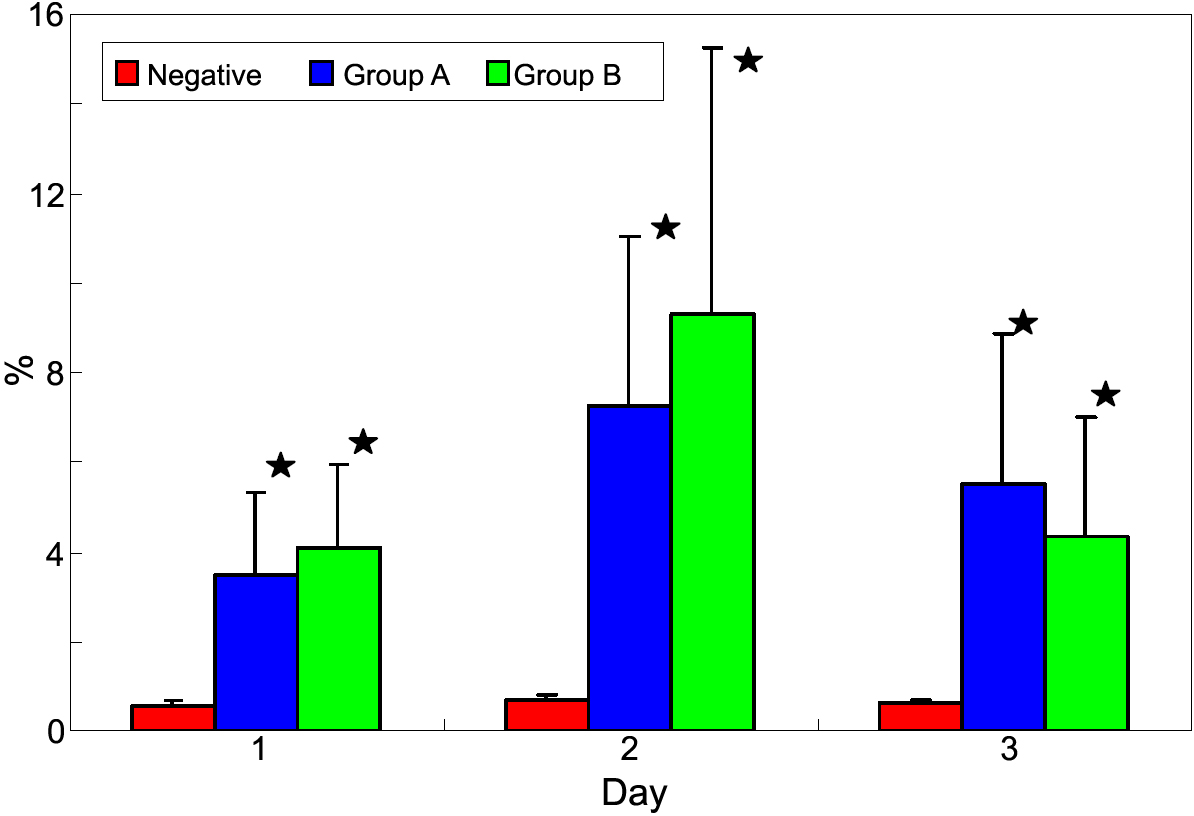
 Figure 5 of
Gu, Mol Vis 2009; 15:99-107.
Figure 5 of
Gu, Mol Vis 2009; 15:99-107.