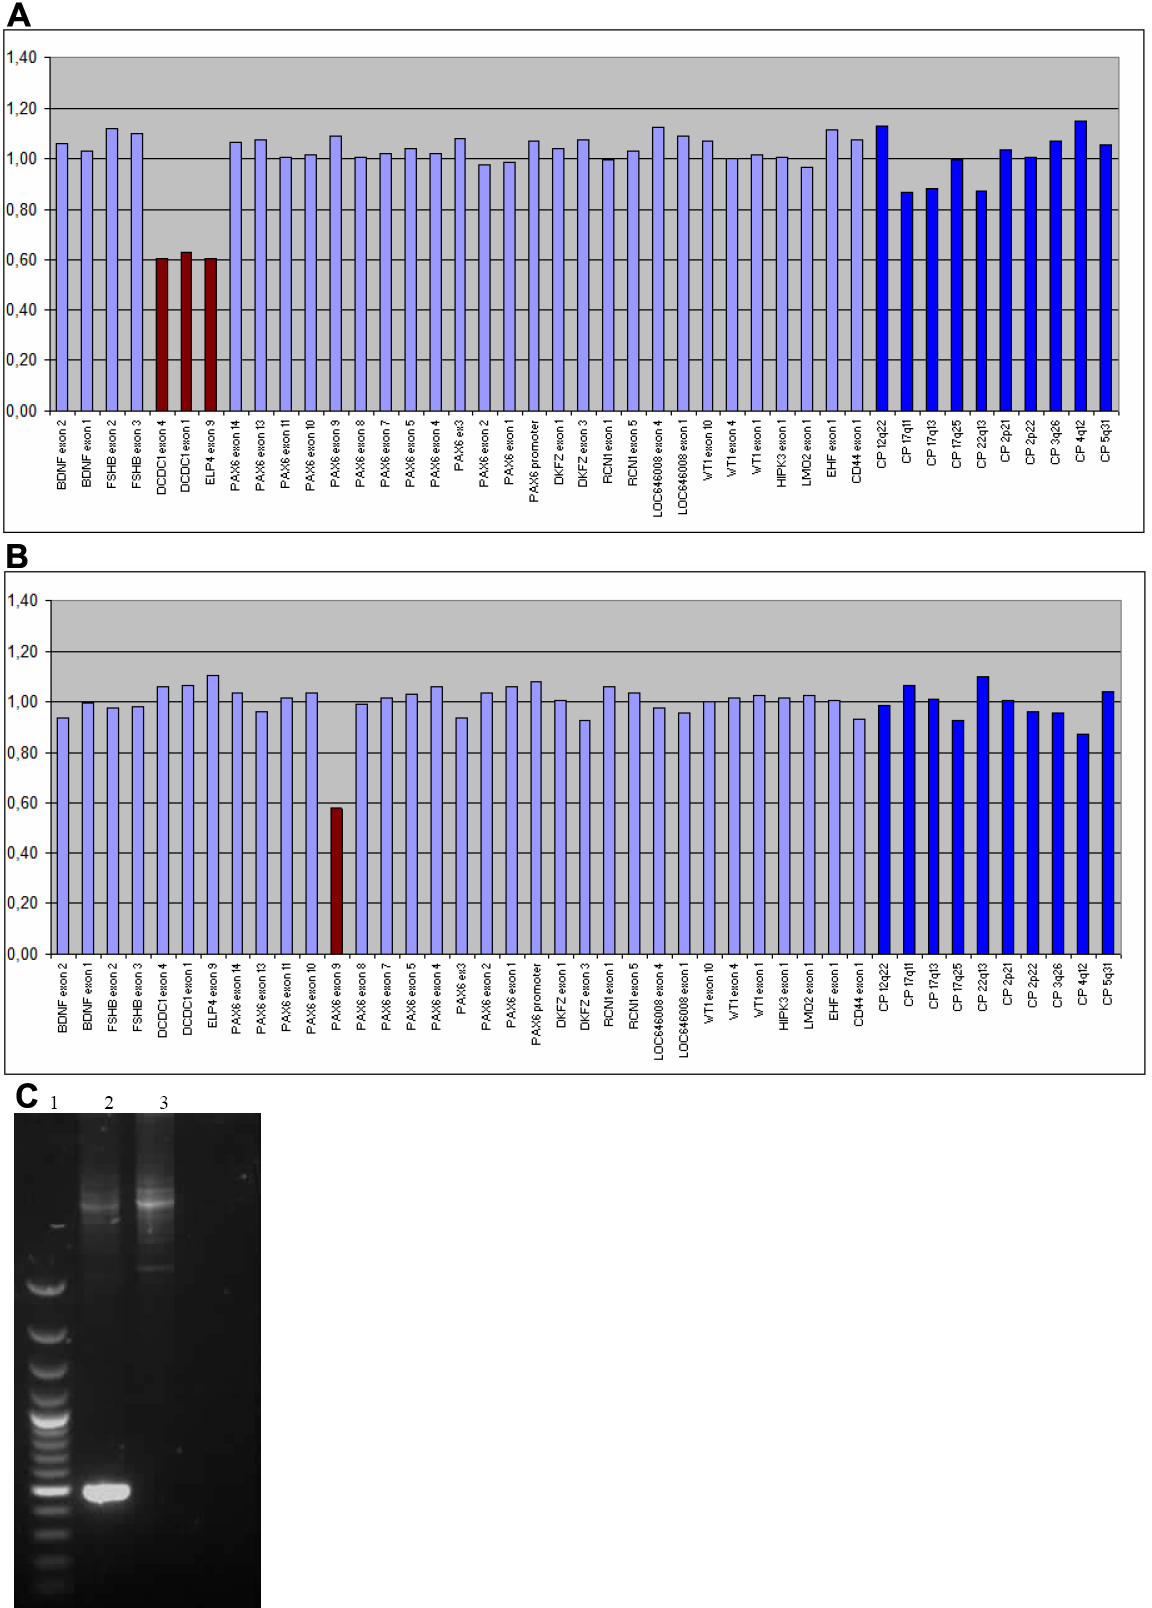
Figure 2. Example of normalized MLPA
results. A and B: The height of the columns represents
the dosage of the respective segments in the genomic DNA with two
alleles (value of about one corresponds to two alleles). The light blue
columns represent the 11p13 specific probes from telomere to
centromere. The brown columns represent the deleted probes. The allele
dosage of the deleted probes was found in the range of about 0.5, which
corresponds to one allele. The dark blue columns represent the control
probes. C: Long range PCR for PAX6 exons 8–10 confirmed
the deletion. The deleted allele is more strongly amplified than the
normal allele due to preferential amplification of smaller fragments.
Lane 1 is a 100 bp ladder size marker; lane 2 is the DNA of the
patient; and lane 3 is a control DNA.