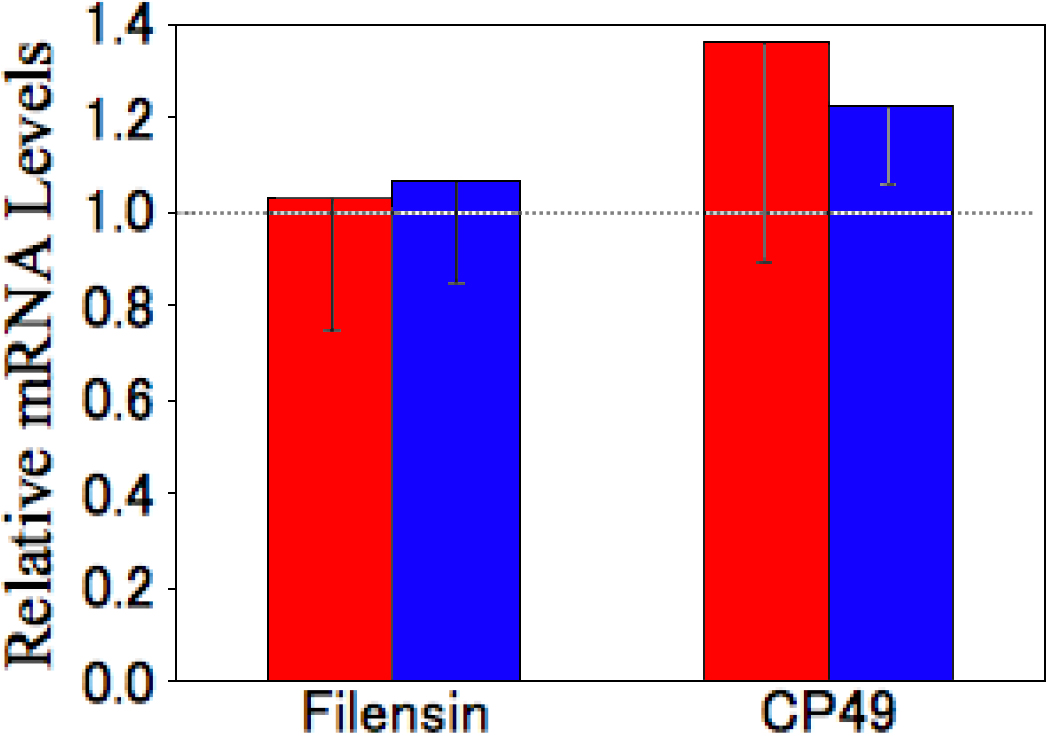
Figure 6. Semi-quantitative analysis of
filensin and phakinin mRNAs. The amounts of filensin and phakinin mRNA
in pre-cataract SCR and normal SCR lenses were analyzed by
semi-quantitative PCR. The data are presented relative to the levels in
Wistar rat lenses (1.0). Solid bars represent pre-cataract SCR lenses,
open bars represent normal SCR lenses. mRNA levels were normalized to
the level of cytoplasmic beta-actin mRNA. Data represents the means and
standard deviation of four independent experiments.