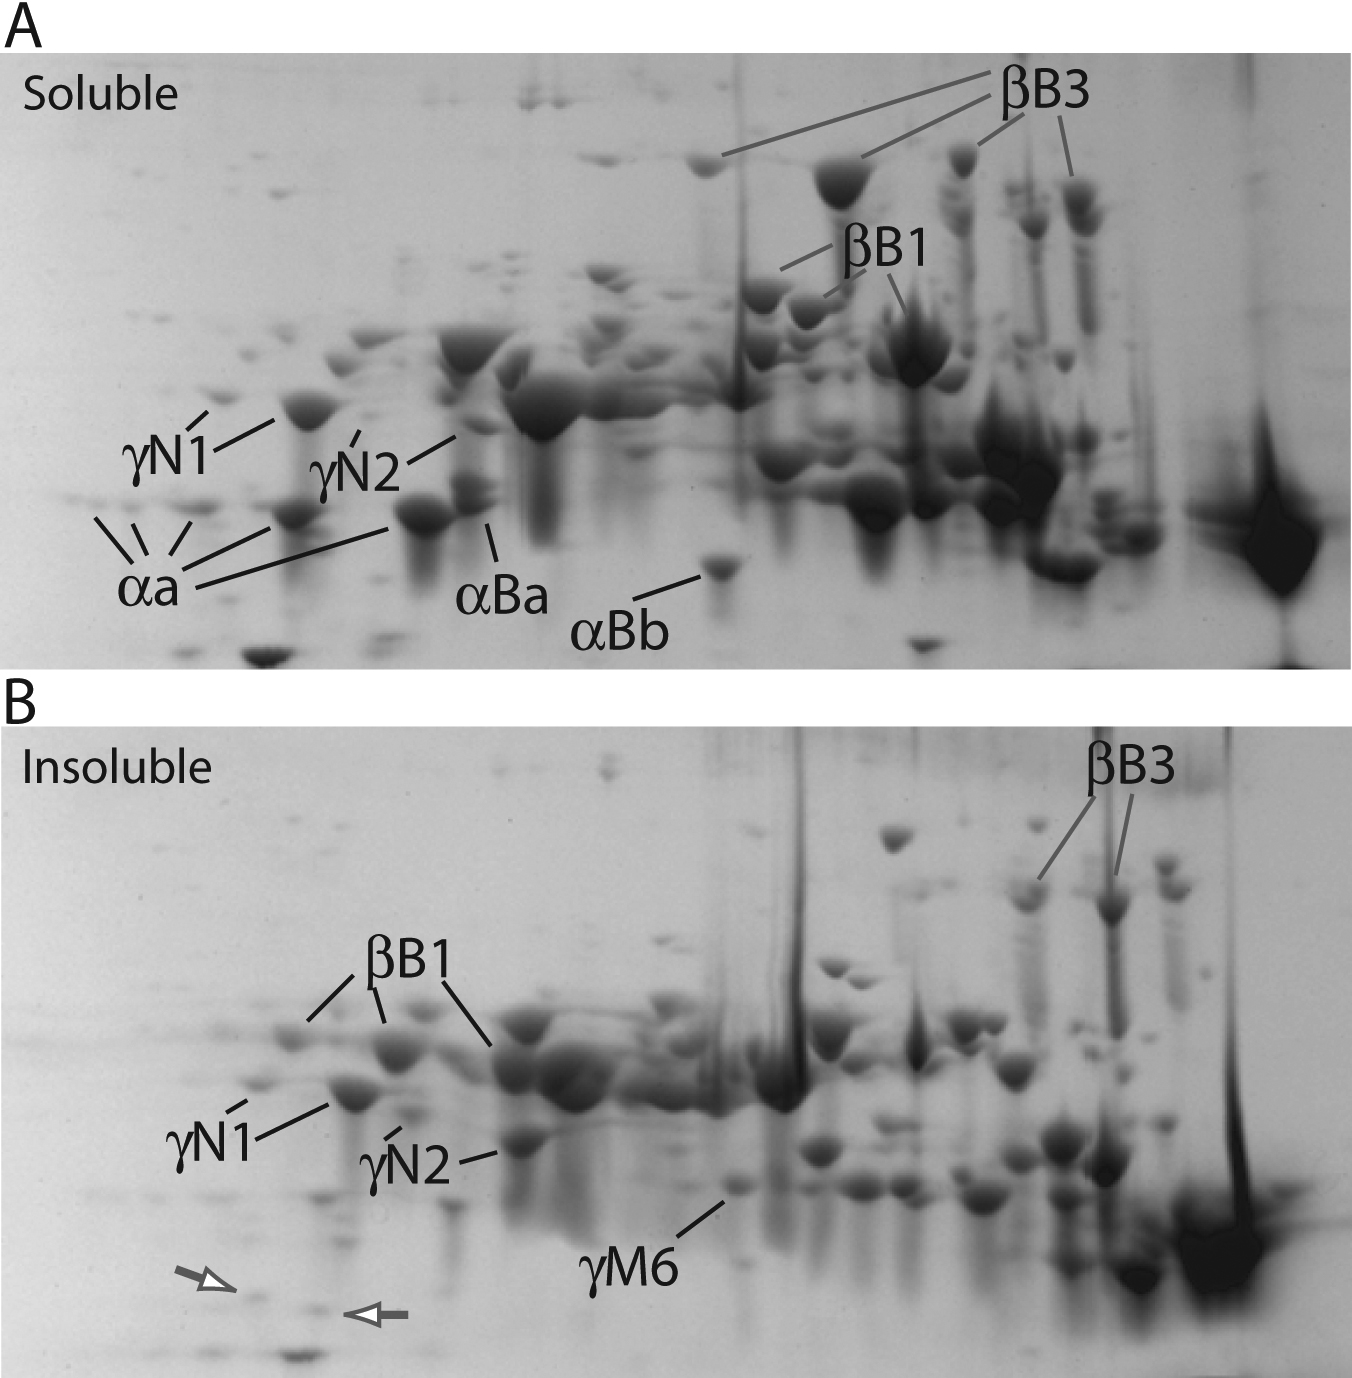
Figure 4. Comparison of soluble and
insoluble protein from adult zebrafish lens. Both soluble (A)
and insoluble (B) fractions were focused on pH 5–8 IPG strips
before SDS–PAGE. Labels indicate examples of spots that are more
abundant in one specific protein fraction (α-, βB1-, βB3-, and
γN2-crystallin) or are equal in abundance in both fractions
(γN1-crystallin). The white arrows on gel B show two α-crystallins that
are preferentially found in the insoluble fraction. Many of the
preferentially insoluble spots appear to be truncations.