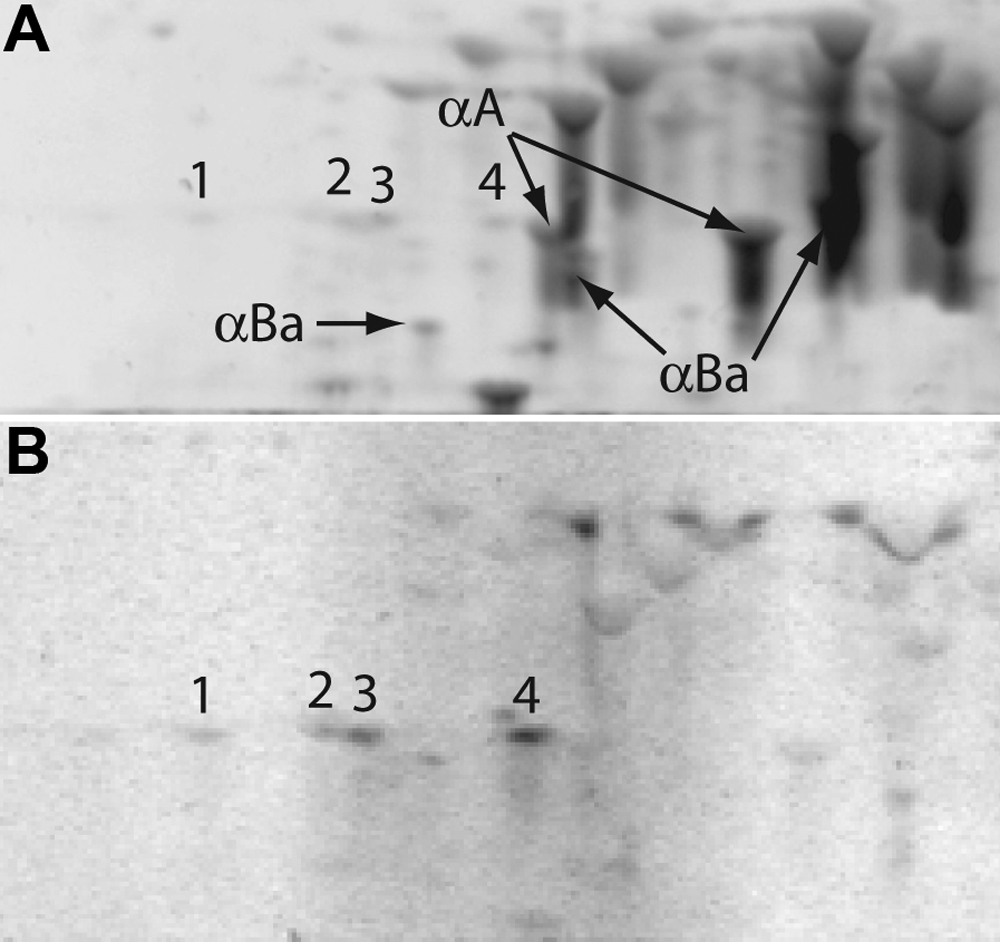
Figure 3. Phosphoprotein staining of
two-dimensional electrophoresis gels (pH 5–8) indicates phosphorylated
αA-crystallins. Numbers identify the equivalent αA-crystallin spots on
gels stained with the total protein stain (A) and the
phosphoprotein-specific stain (B). Labels and arrows indicate
α-crystallin spots that were not detected by the phosphoprotein stain.