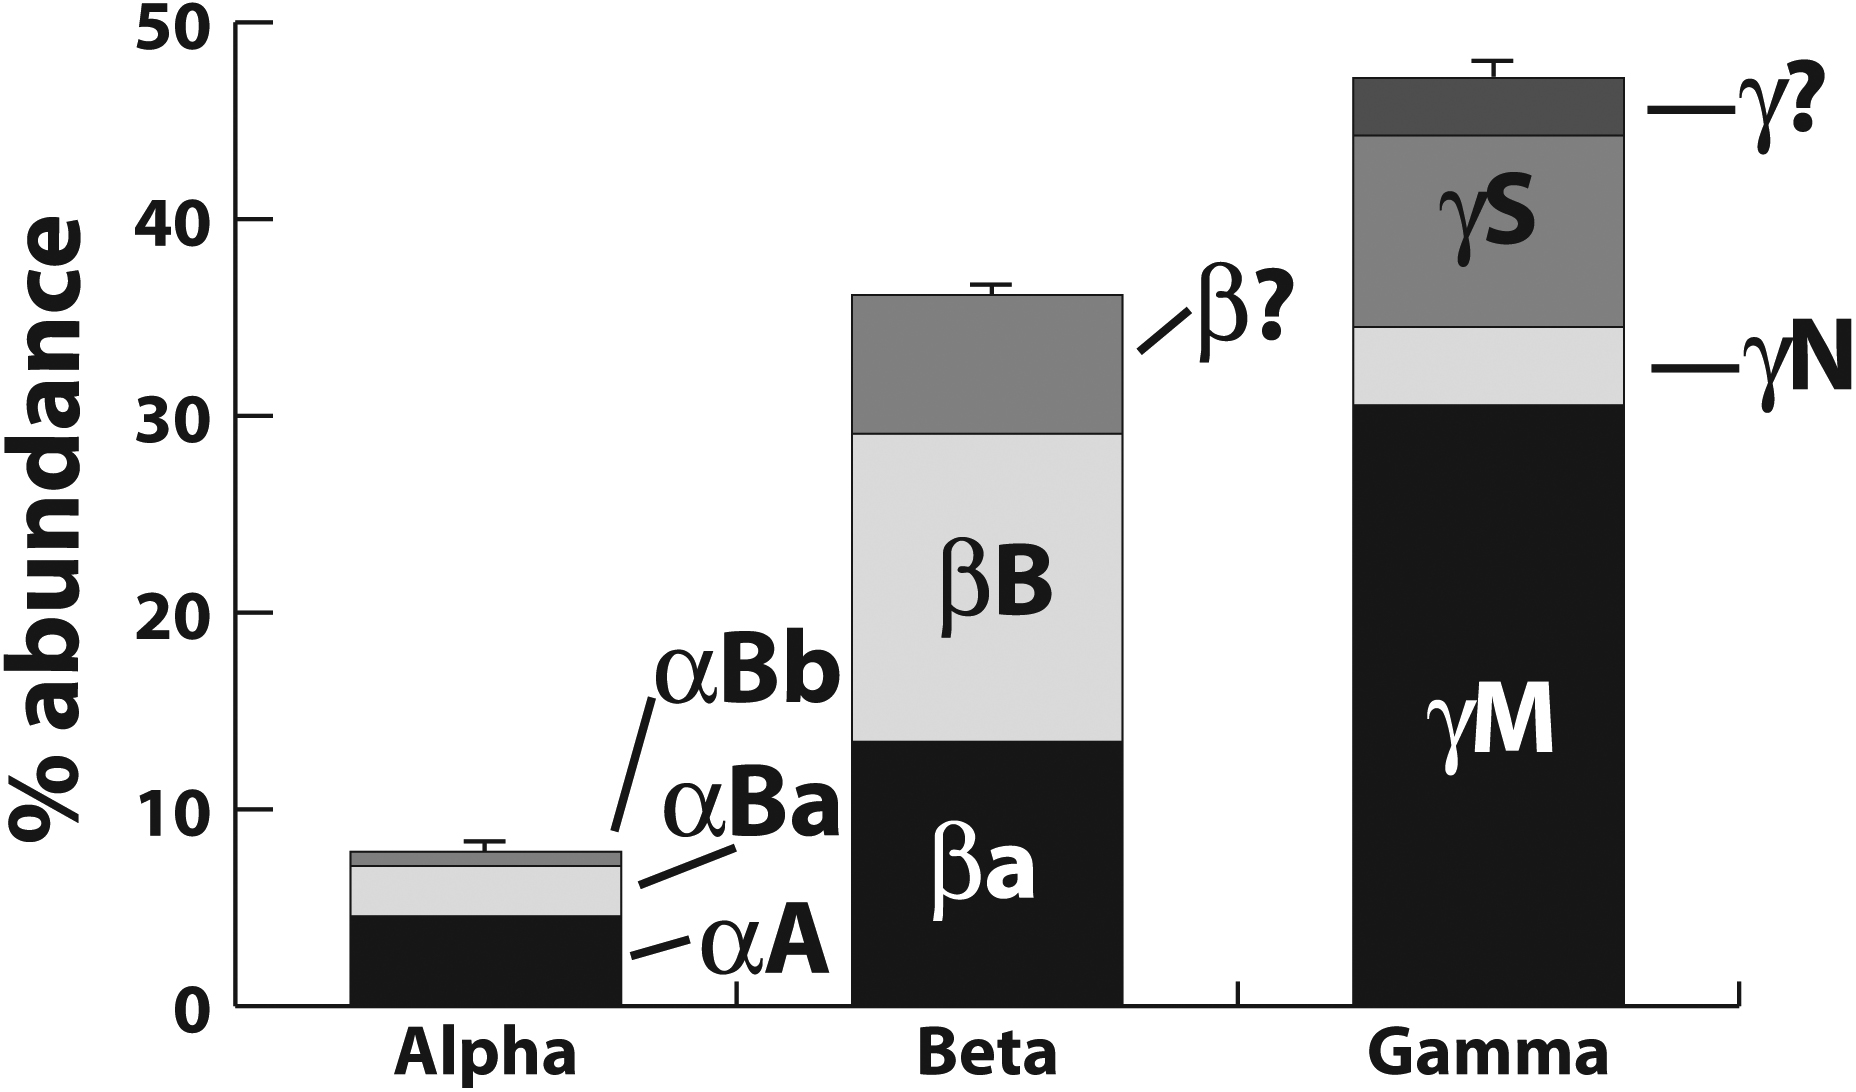
Figure 2. Proportion of α-, β-, and
γ-crystallins in the zebrafish lens determined by densitometry of
Coomassie stained two-dimensional electrophoresis gels. Each crystallin
family is further subdivided as labeled. Error bars show standard
deviation for three separate lens samples. Abundance of protein spots
that were identified only to family or contained more than one member
of each family are indicated with question marks.