Figure 9. Eruption of neurites into the choroid. Visualization: Quantitative gray-scale images of molecular signals displayed as intensity.
Up arrows, remnant retina-choroid interface; horizontal arrows, neurons and neurites migrating in the choroid; angled arrows,
eruption site. Each panel is 0.550 mm wide. A: Glutamate signals do not readily reveal any interruption in the MC seal. B: Glutamine signals generally indicate that the MC seal is confluent, though subtle variations in signal strength between the
slanted arrows suggests an altered environment. C: Taurine signals do not readily reveal any interruption in the MC seal. D: Glycine signals indicate an eruption. Many glycinergic structures are located in the choroid distal to the arrows. E: γ-aminobutyric acid signals signals clearly indicate amacrine cell processes are entering the choroid. Sample metadata: SD
Rat, age at LX 60 d, animal #P240–3L-48–240, left eye, 48 h LX, harvested at 240 days pLX, bloc code 6693, slide code 3528.
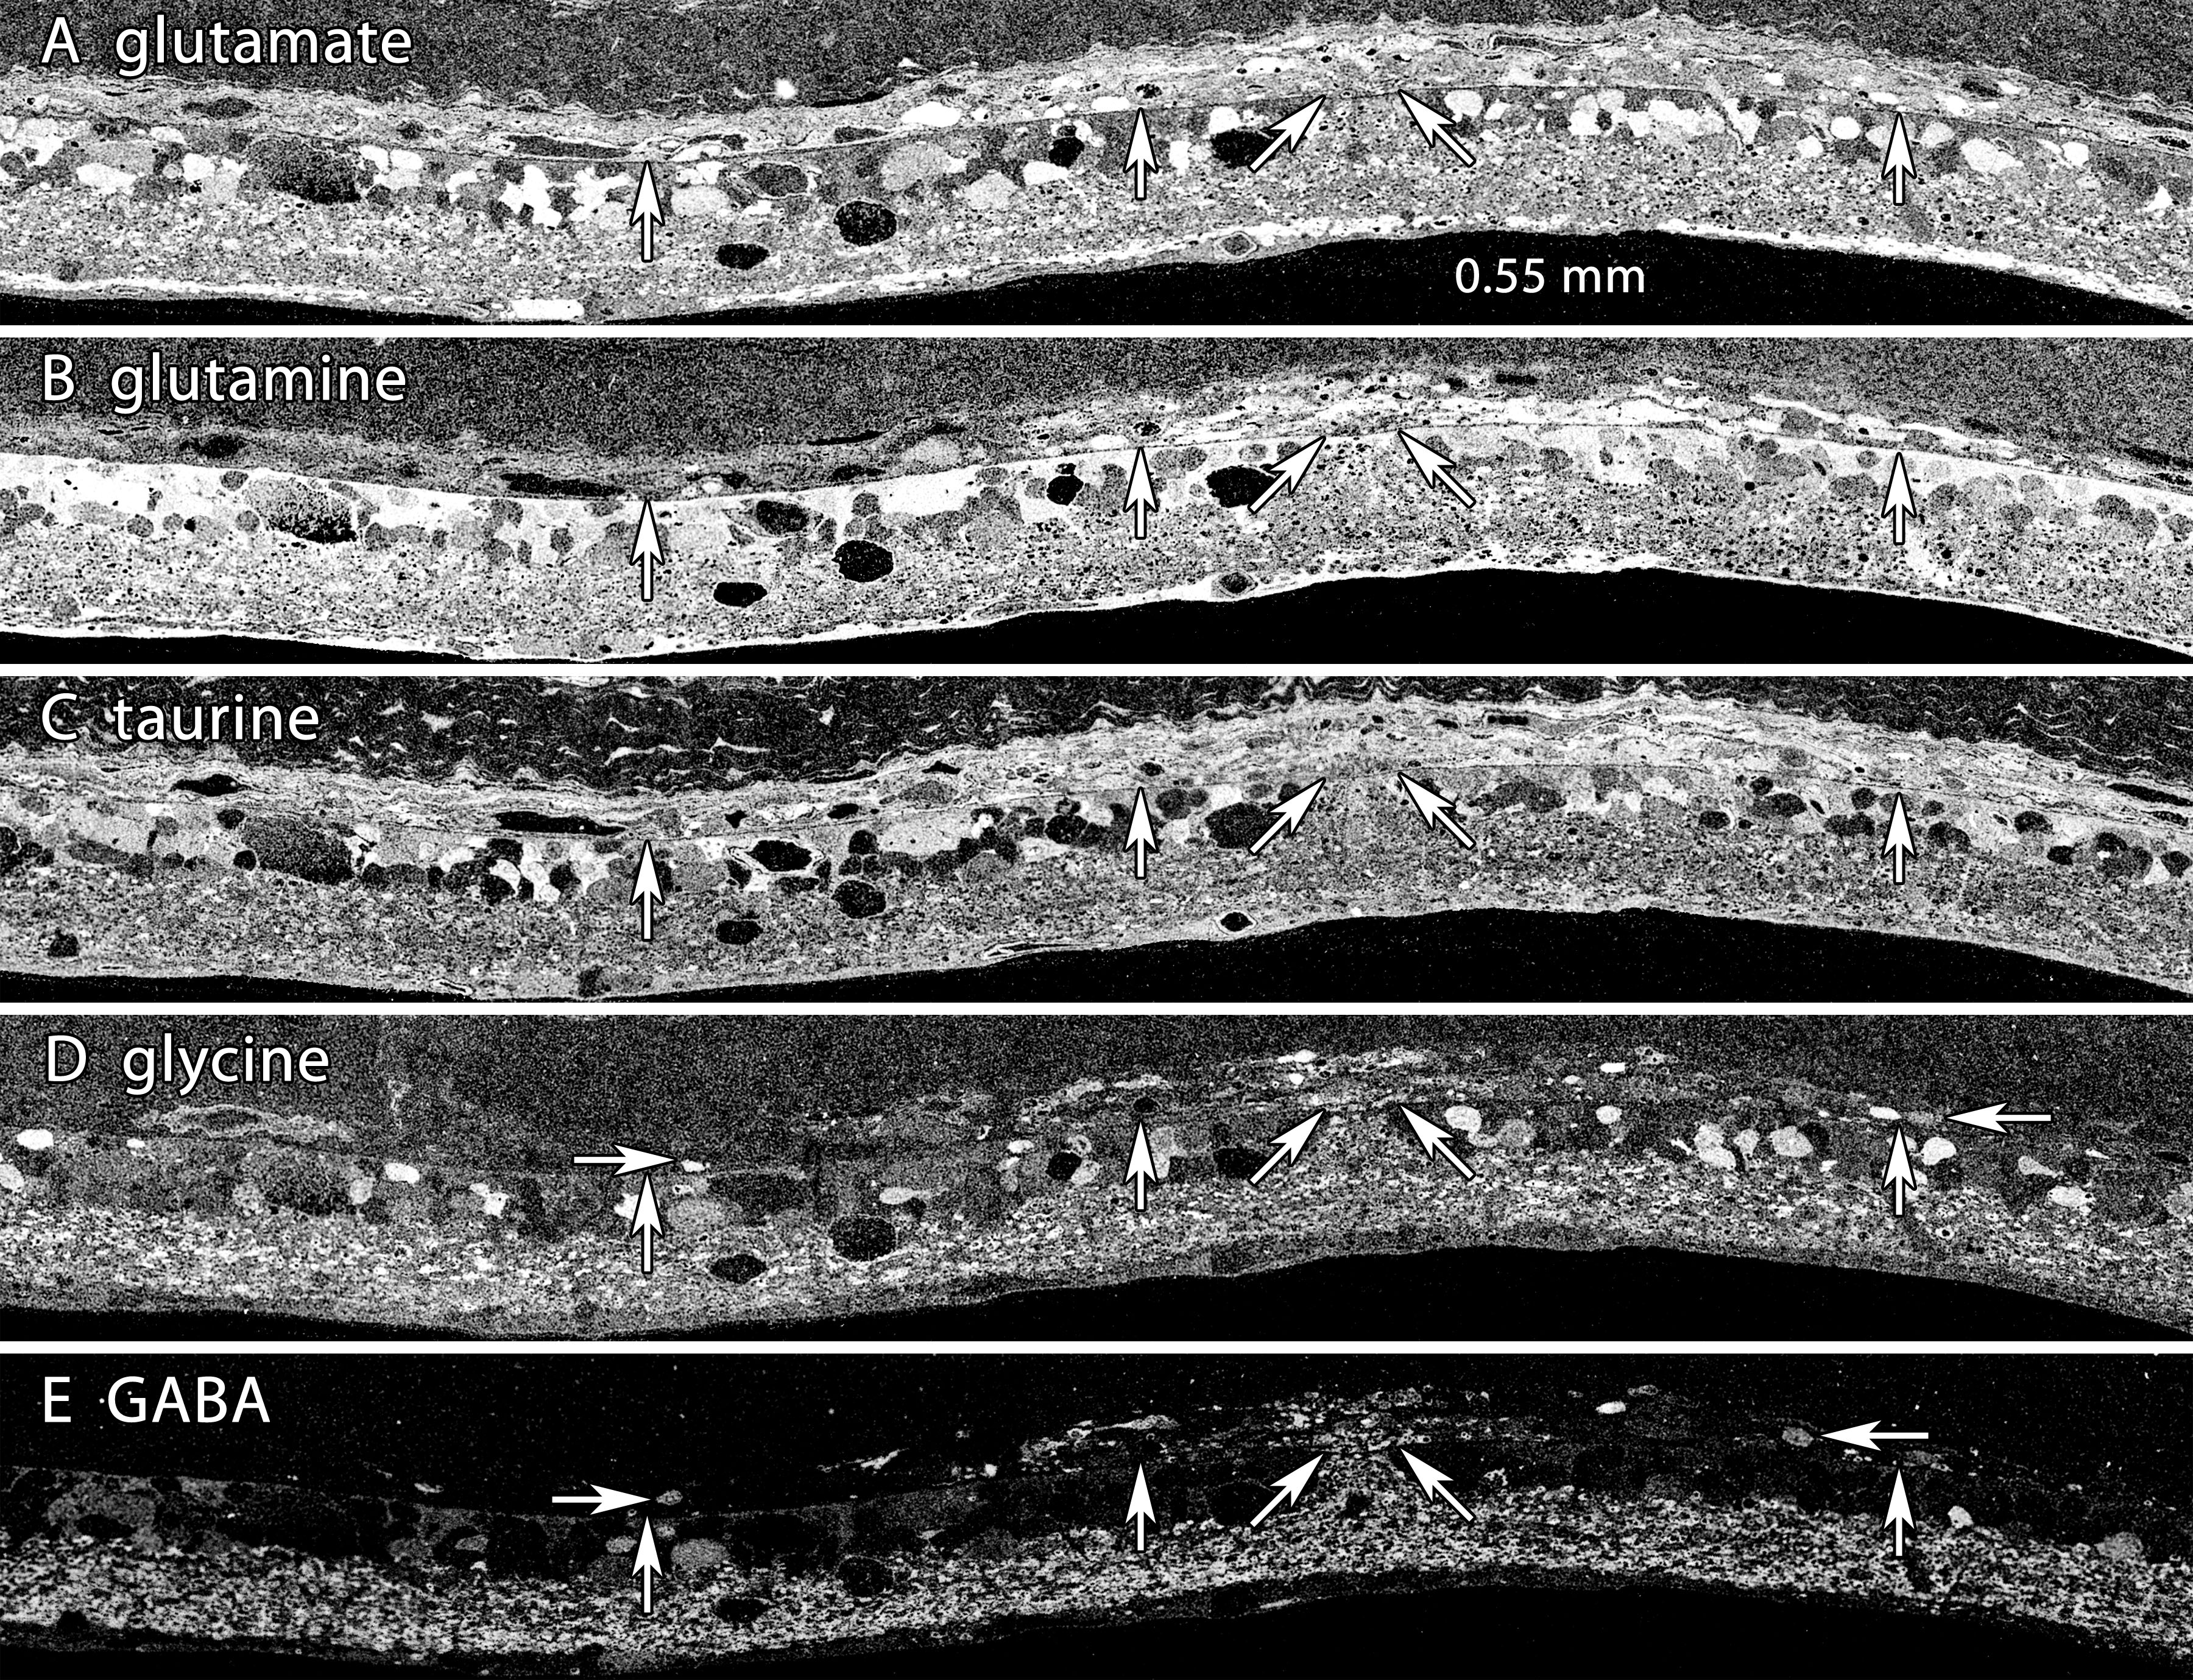
 Figure 9 of
Marc, Mol Vis 2008; 14:782-805.
Figure 9 of
Marc, Mol Vis 2008; 14:782-805.