Figure 8. Neuronal migration columns and microneuromas in light induced retinal damage. Visualization: Quantitative gray-scale images
of molecular signals displayed as intensity. Down arrows mark the remnant retina-choroid interface, arrows delimit an intense
remodeling zone with disruptions in the integrity of the MC glutamine-rich seal and emergence of both migrating neurons and
clusters of new neurites (ovals). Abbreviations, acl is amacrine cell layer, ipl is inner plexiform layer, gcl is ganglion
cell layer. Each panel is 0.782 mm wide. A: Glutamate signals reveal a distinctive non-neural seal between glutamate-rich remnant bipolar cells and the choroid and a
mixture of high-glutamate elements in the remodeling column. B: Glutamine signals are extremely high in the remnant retina and lower in the choroid. The signals in the seal and migration
column are exceptionally high, with some darker islands within the column. C: Glutamine histogram equalization (eq) highlights the seal, the column and the lower glutamine levels of cells between the
arrowheads. D: Taurine levels demonstrate recovery from the early depletion at 14–50 pLX. E: Glycine signals highlight migrating neurons within the column and new processes streaming distally (oval). F: γ-aminobutyric acid signals display the development of new amacrine cell neurites in the column. Sample metadata: SD Rat,
age at LX 60 d, animal #P180–2L-48–120, right eye, 48 h LX, harvested at 120 days pLX, bloc code 6628, slide code 3535.
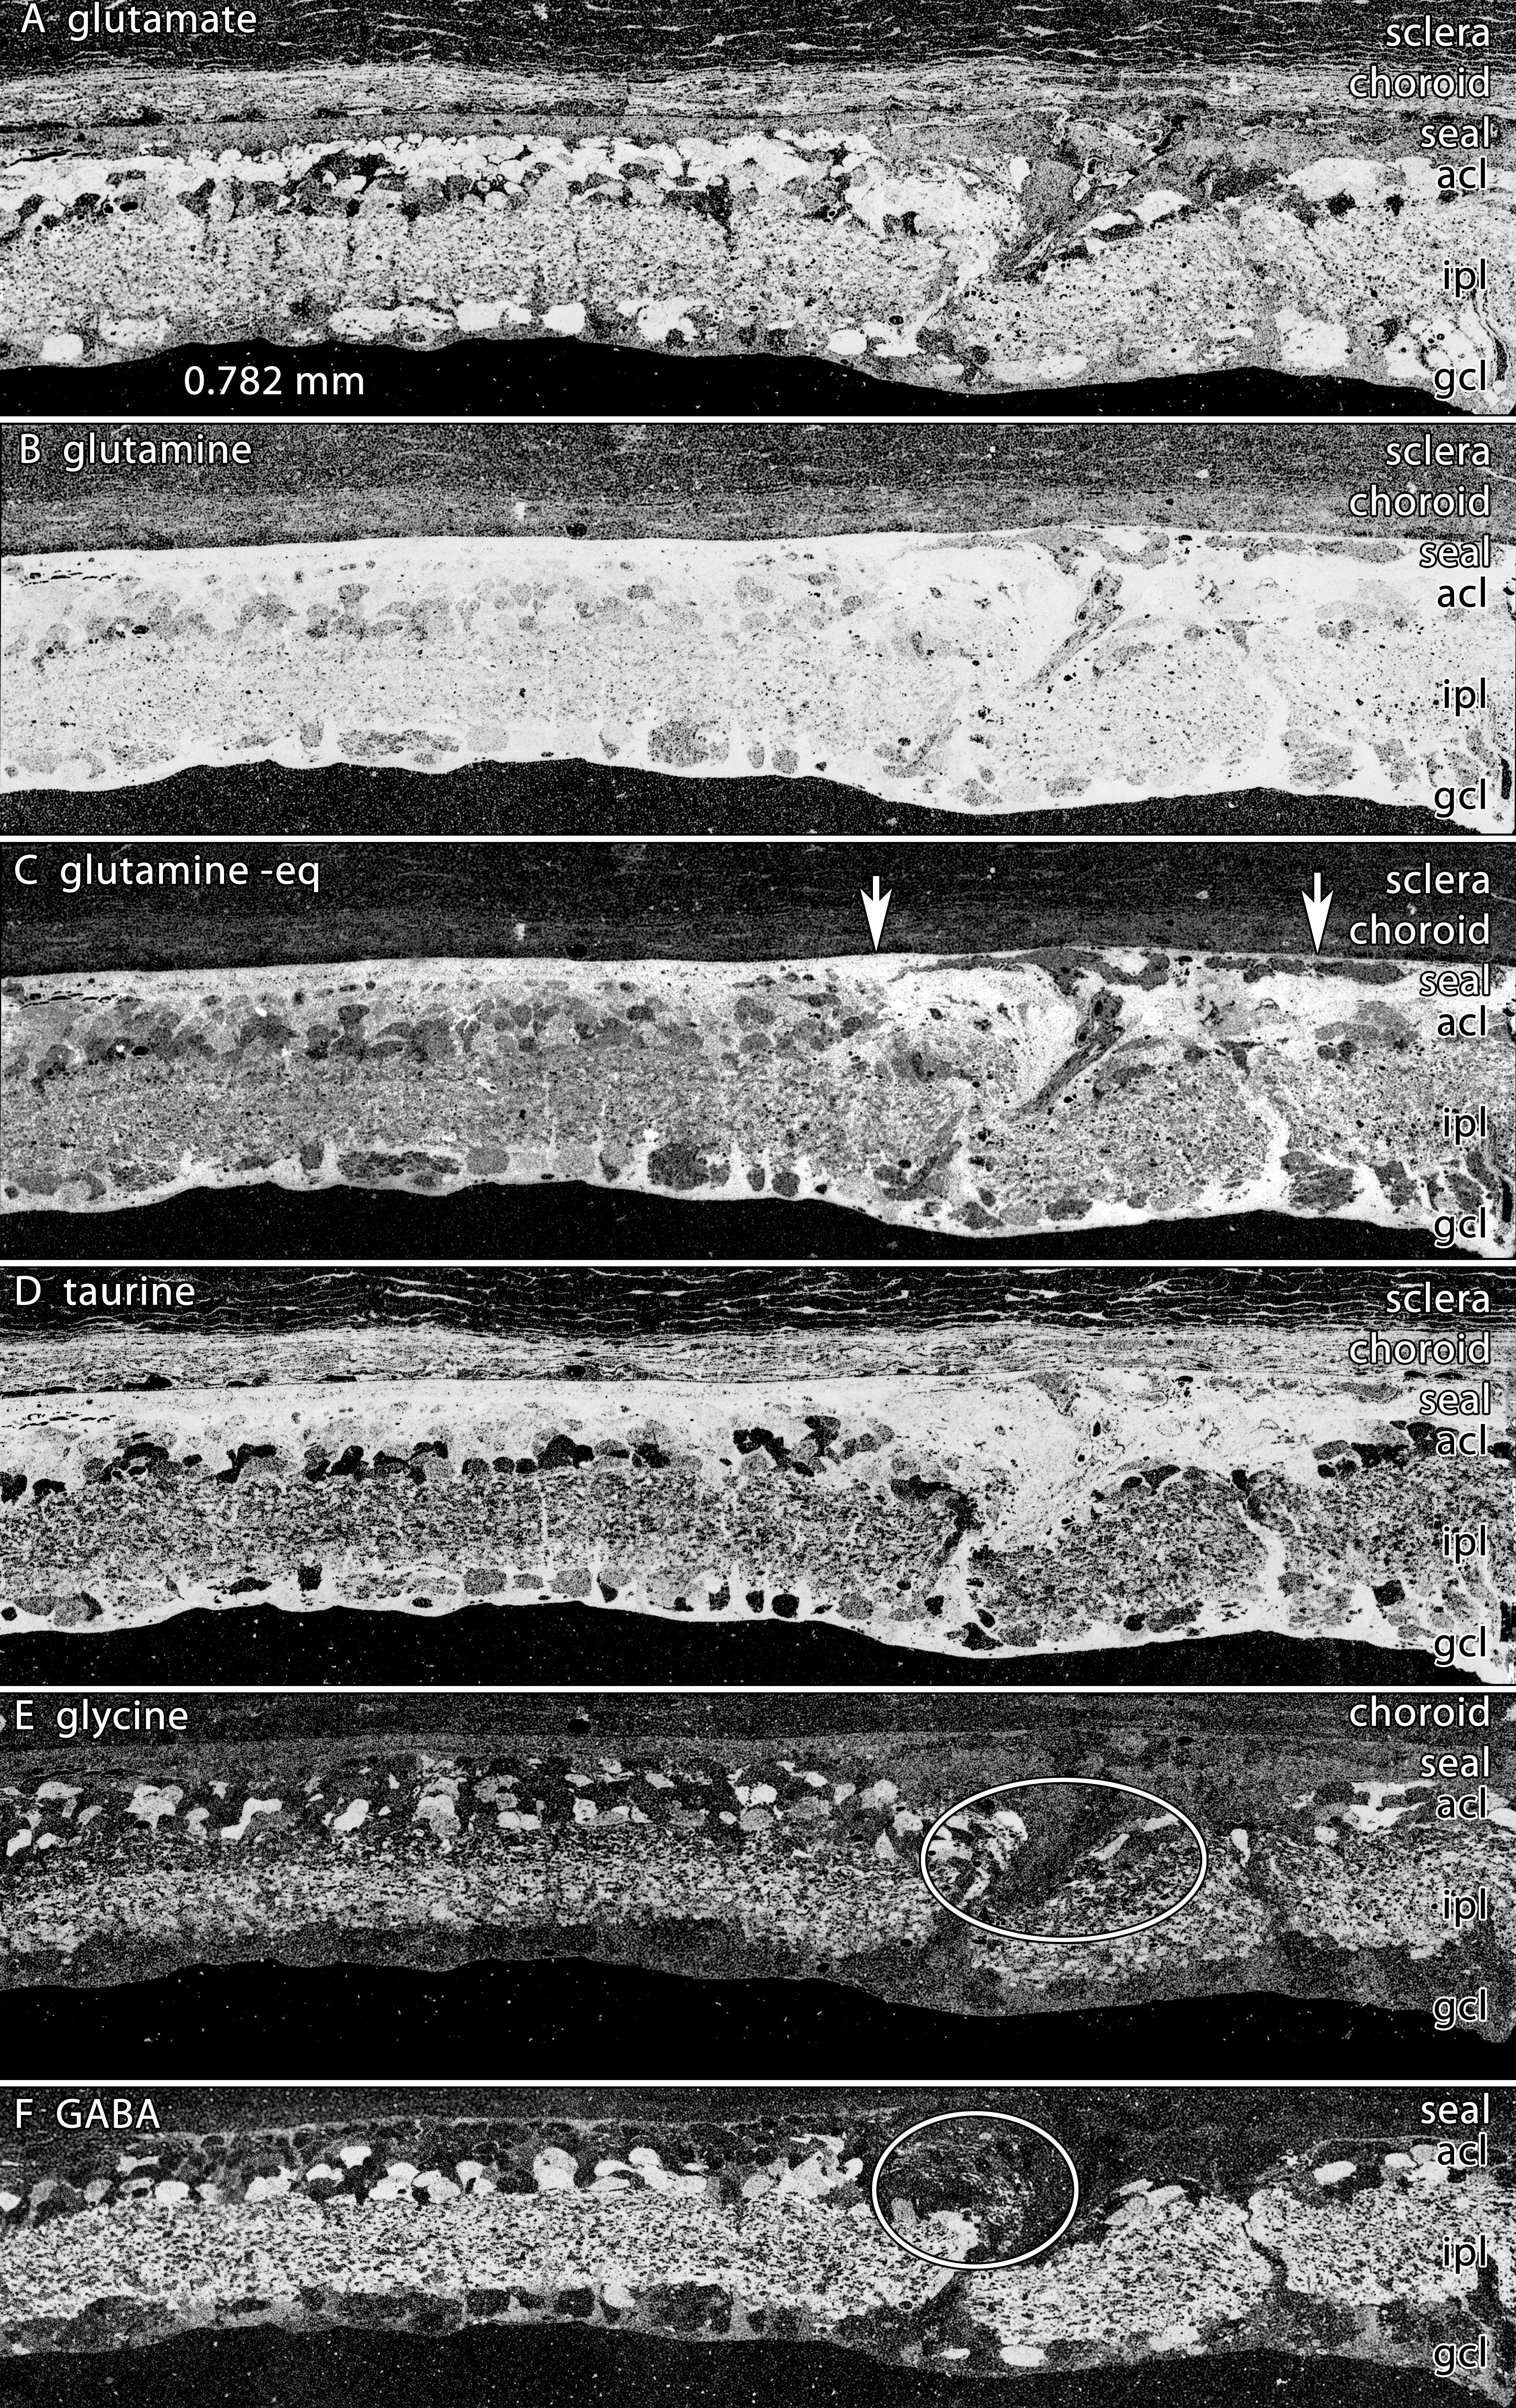
 Figure 8 of
Marc, Mol Vis 2008; 14:782-805.
Figure 8 of
Marc, Mol Vis 2008; 14:782-805.