Figure 6. Emergence of the high glutamine MC seal by pLX 14. Visualization: Quantitative gray-scale images of glutamine signals displayed
as density in two separate retinas, one displaying buckled margins (A) and the other with smooth margins (B). Down arrows, choroid-retina interface bracketing the LD zone; asters, section damage. Scale: The panels are 1.88 mm wide.
Sample A metadata: SD Rat, age at LX 60 d, animal #VO 01–56 SDCRLD8–5PM-2WK-2L, left eye, 8h LX onset at 5PM, harvested 14d
pLX,bloc code 6547, slide code 3304. Sample B metadata: SD Rat, age at LX 60 d, animal #VO 01–69 SDDRLD3–5PM-2WK-3L, left
eye, 8h LX onset at 5PM, harvested at 14 days pLX, bloc code 6560, slide code 3319.
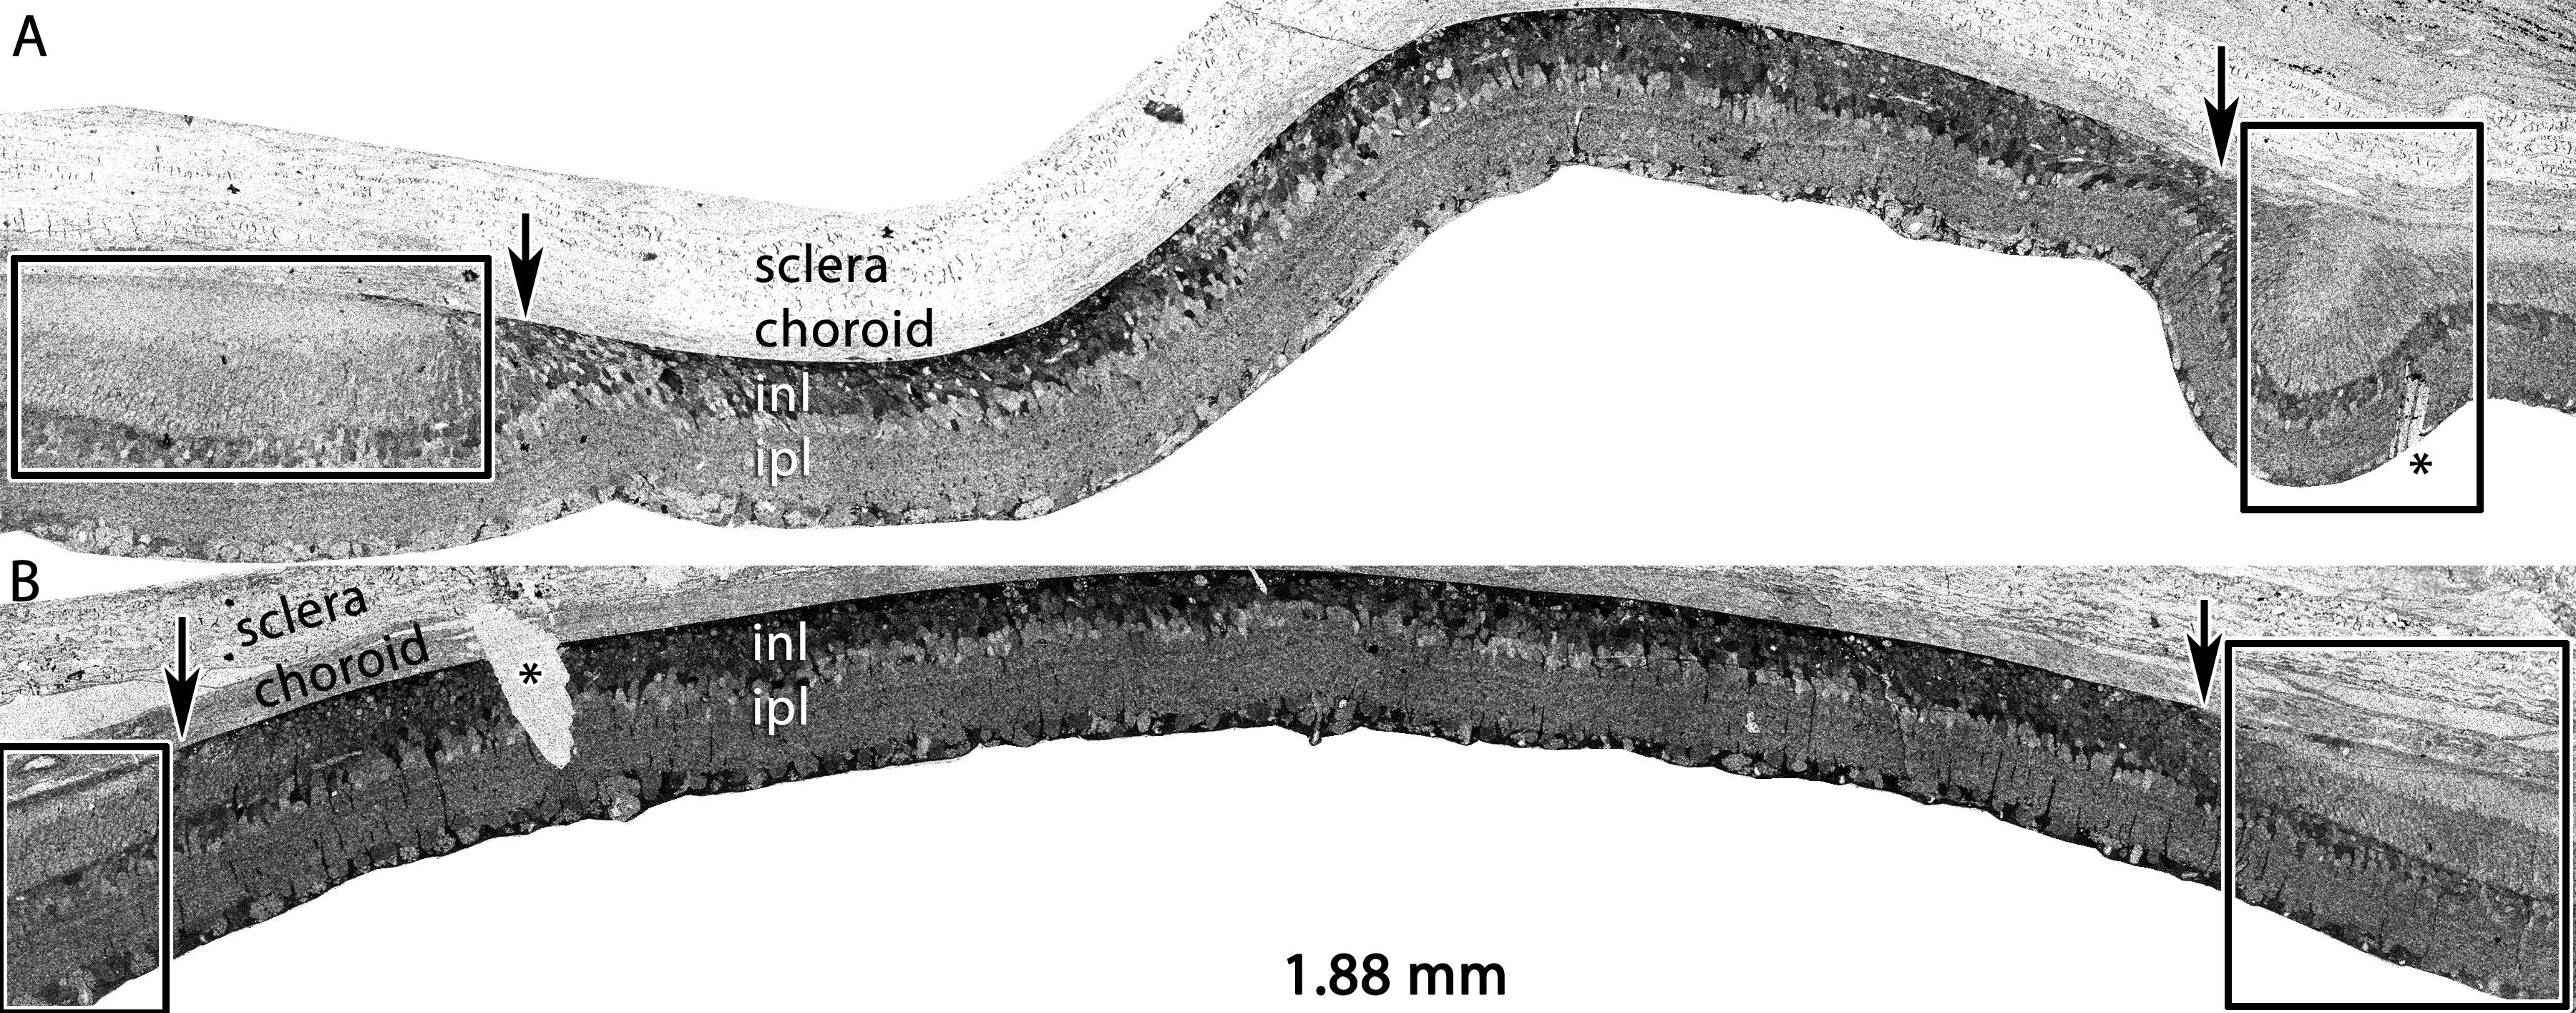
 Figure 6 of
Marc, Mol Vis 2008; 14:782-805.
Figure 6 of
Marc, Mol Vis 2008; 14:782-805.