Figure 5. Altered molecular signature mixtures immediately after 48 h of light exposure. Visualization: CMP images displayed as intensity
in a mirror-image pair. Up arrows, choroid-RPE interface; oblique arrowhead mark stressed rods. Abbreviations: IPL represents
inner plexiform layer, INL represents inner nuclear layer. Scale: All panels are 0.187 mm wide. A: τQE::rgb mapping demonstrates the remarkable inversion of the MC profile from normal high τQ, low E to abnormal low τ, high
QE and severe depletion of the RPE layer (ovals). B: D, J: 1d4::rgb mapping concurrently displays rod opsin mislocalization, high aspartate stress signals in selected rods (oblique
arrowheads), and severe disruption of the external limiting membrane-photoreceptor interface (boxes). Sample metadata: SD
Rat, age at LX 60 d, animal #P60–1L-48, left eye, 48 h LX, harvested at 0 days pLX, bloc code 6464, slide code 3548b.
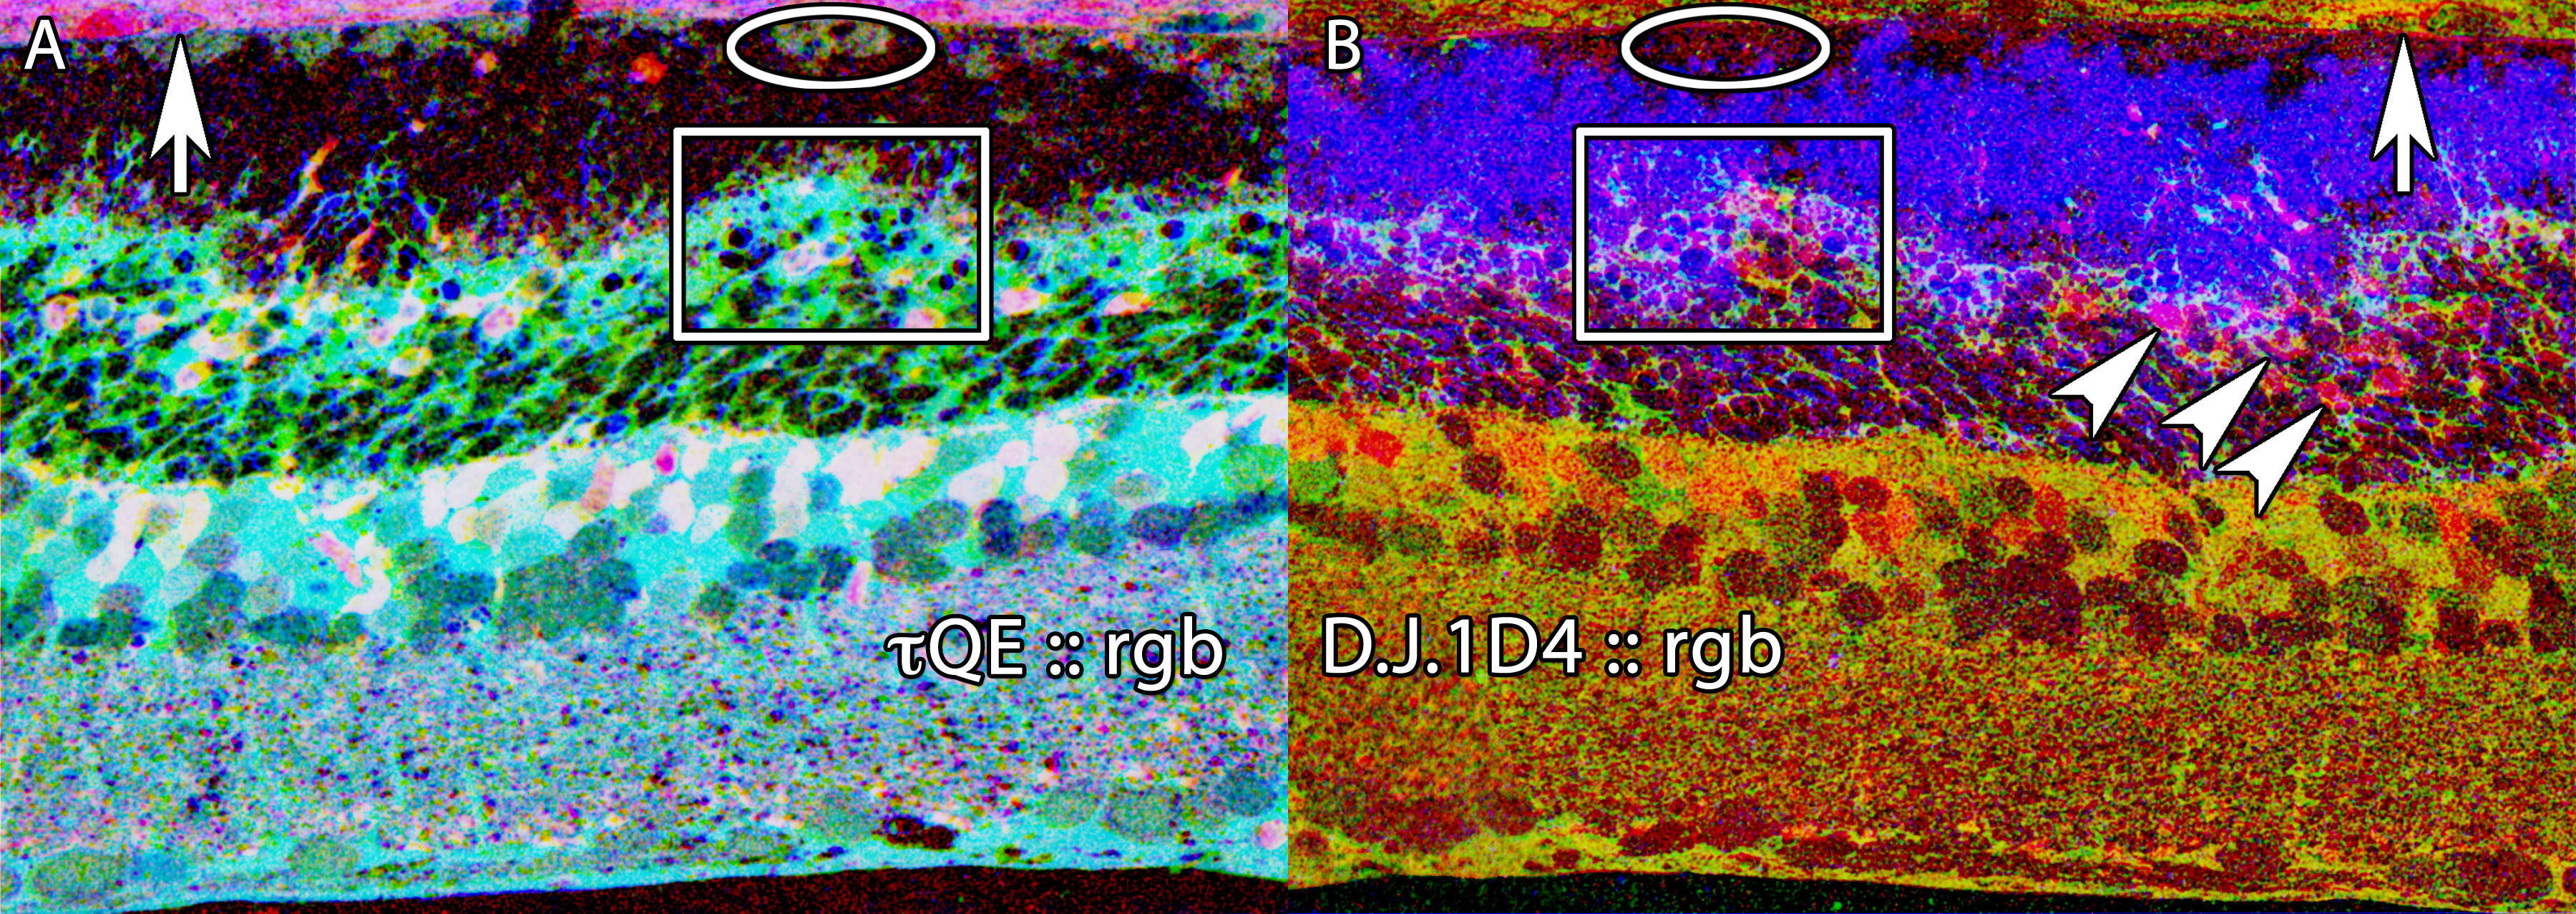
 Figure 5 of
Marc, Mol Vis 2008; 14:782-805.
Figure 5 of
Marc, Mol Vis 2008; 14:782-805.