Figure 4. Altered molecular signatures immediately after 48 h of light exposure. Visualization: Quantitative gray-scale images displayed
as intensity in mirror-image pairs (AB, CD, EF, GH). Up arrows, choroid-retinal pigment epithelium (RPE) interface; down arrows, Müller cell (MC) end feet; oblique arrows mark
the border of the outer nuclear and outer plexiform layers. Scale: All panels are 0.187 mm wide. A: Glutamine signatures are elevated in MCs, with hypertrophy of distal MC processes at the external limiting membrane (box).
The RPE layer is severely damaged, with only a few distinct cells (oval). B: Massive taurine depletion in MCs (down arrows) and abnormal elevation in photoreceptors (oval) and bipolar cells. C: 1D4 rod opsin reveals extreme disorganization of rod outer segments and extensive mislocalization of rod opsin into rod somas.
D: Glutathione signatures highlight the disorganization of MC processes in the outer retina. E: Aspartate signals are abnormally high in rod inner segments. F: Glutamate signals in particular are abnormally elevated in MCs. G, H: Glycine and γ-aminobutyric acid (GABA) signals seem essentially normal, with no evidence of ischemia or excitotoxicity. Sample
metadata: SD Rat, age at LX 60 d, animal #P60–1L-48, left eye, 48 h LX, harvested at 0 days pLX, bloc code 6464, slide code
3548b.
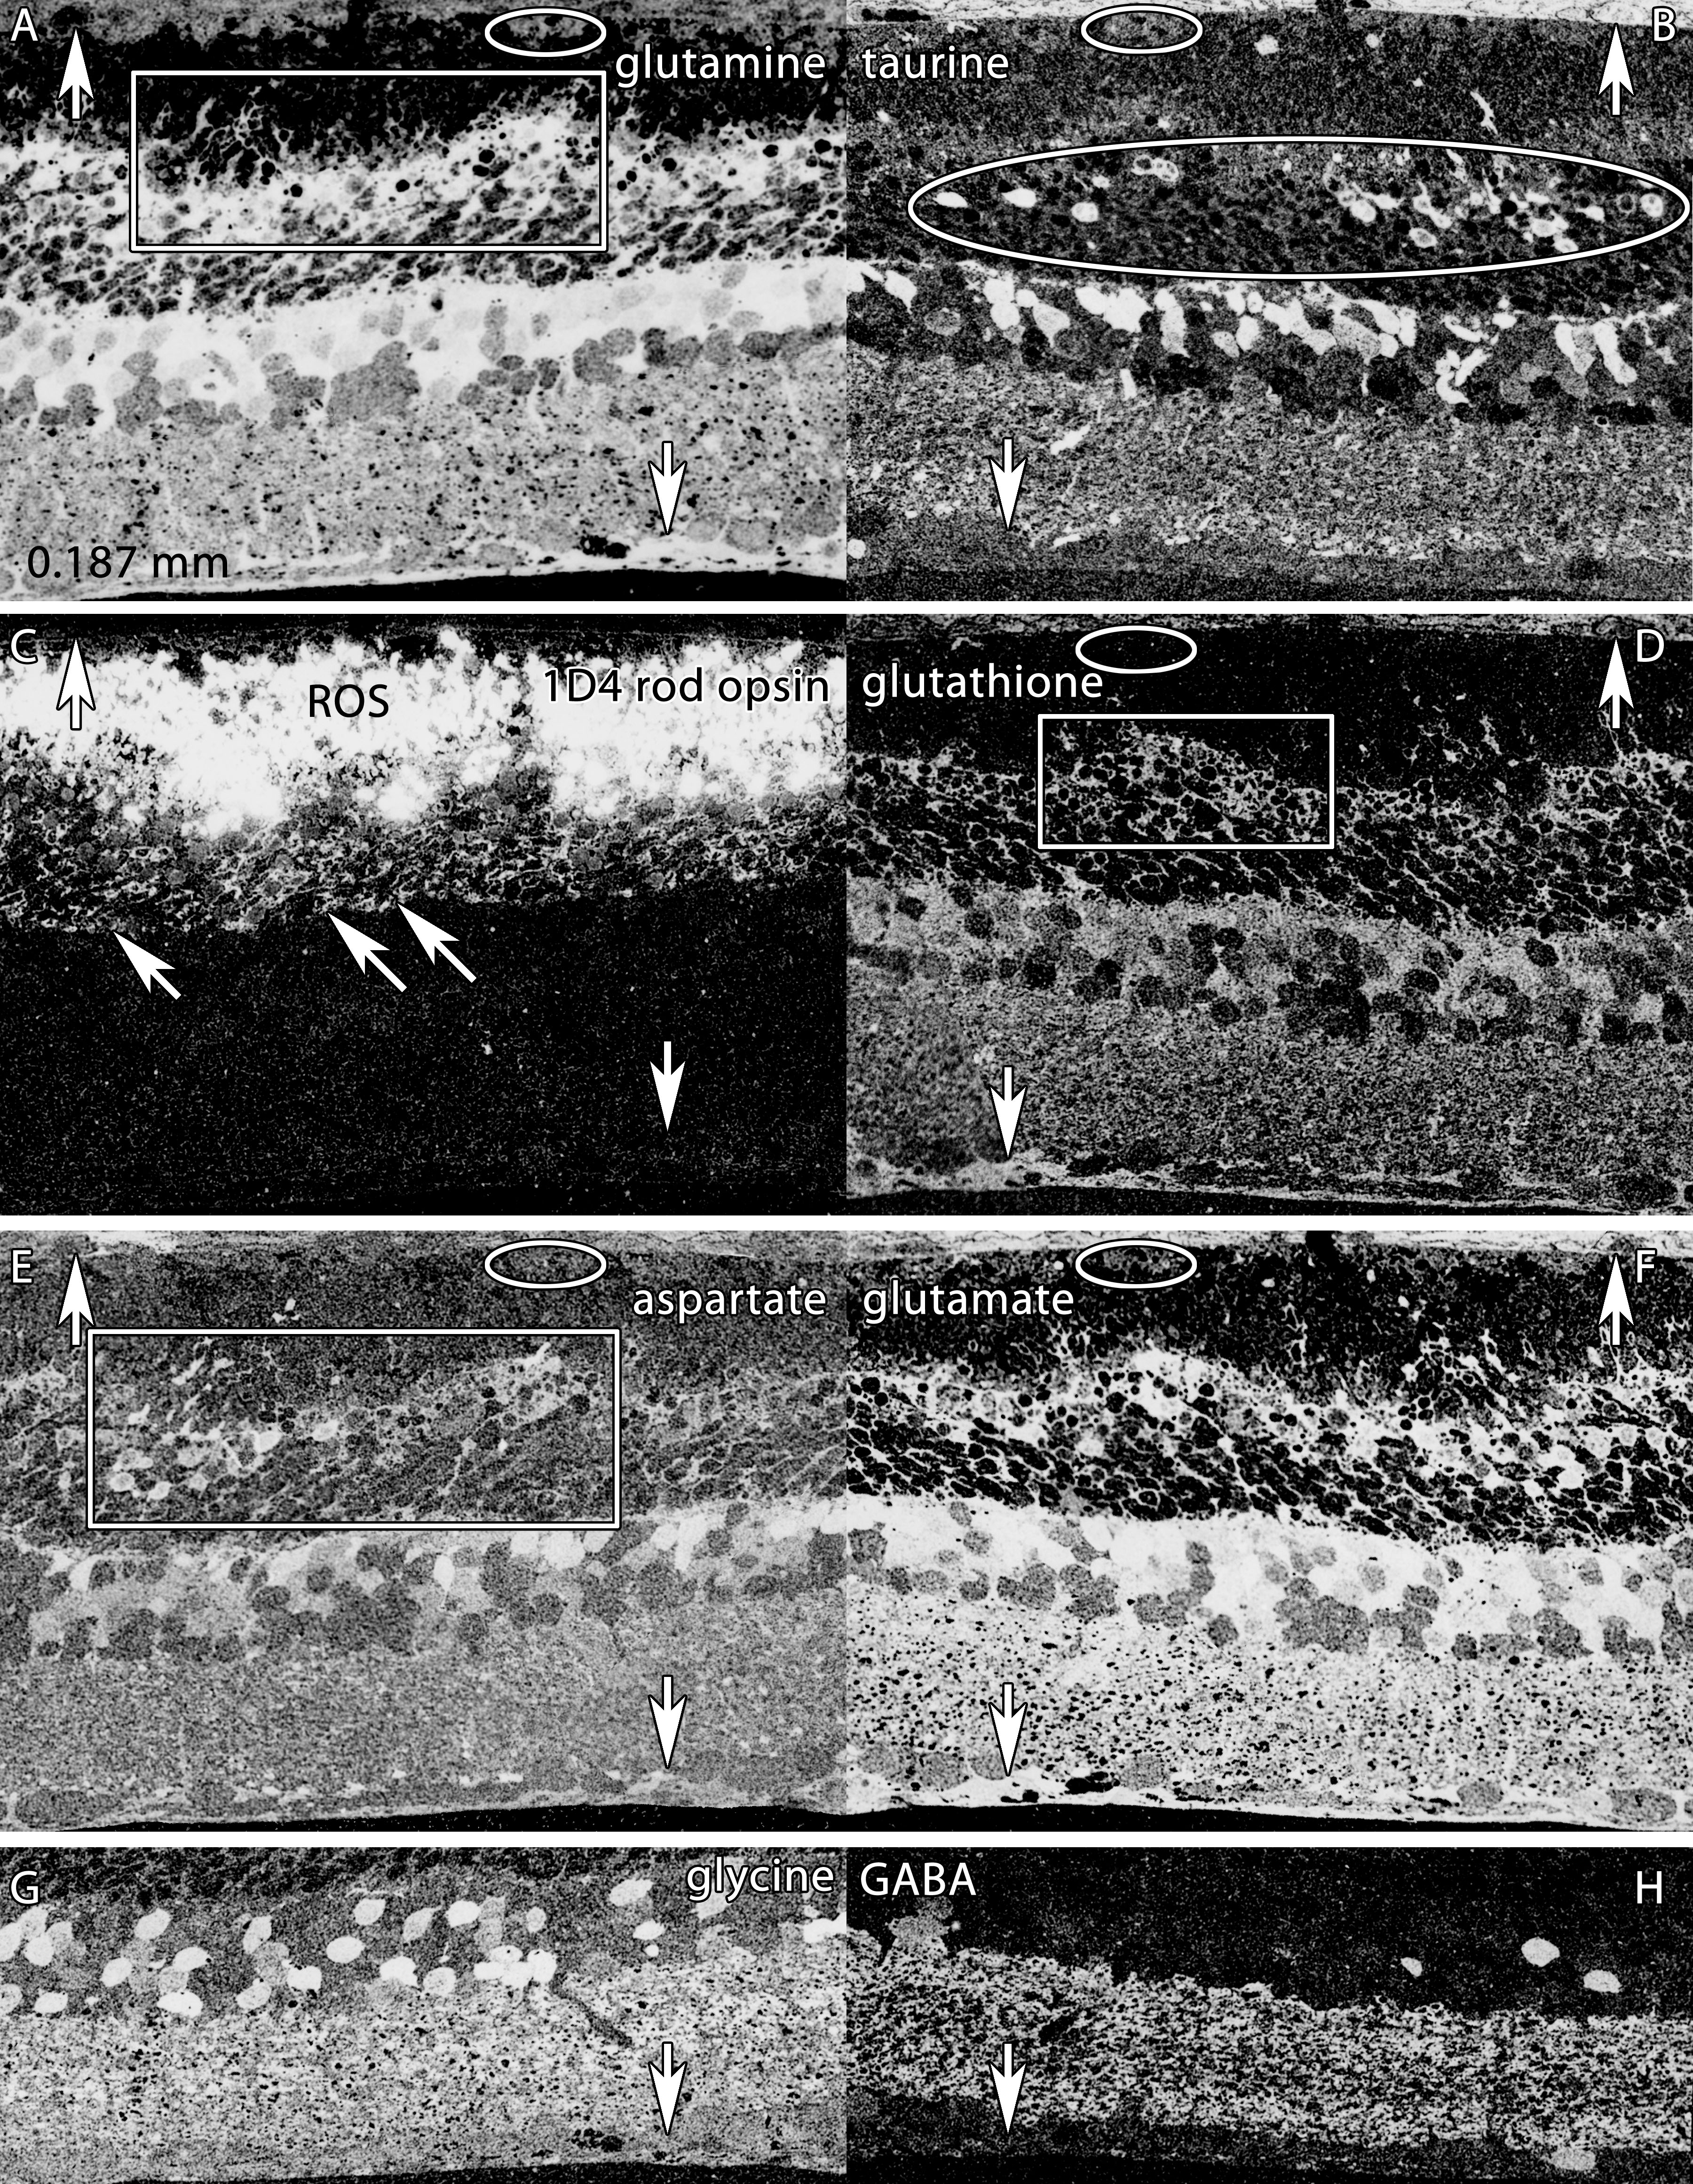
 Figure 4 of
Marc, Mol Vis 2008; 14:782-805.
Figure 4 of
Marc, Mol Vis 2008; 14:782-805.