Figure 3. Basic molecular signature mixtures in the normal albino rat retina. Visualization: computational molecular phenotyping (CMP)
images displayed as intensity in a mirror-image pair. Up arrows, RPE; down arrows, Müller cell (MC) end feet; oblique arrows
mark the border of the outer nuclear and outer plexiform layers. Scale: All panels are 0.332 mm wide. A: Taurine (τ), glutamine (Q), glutamate (E) mixtures in a τQE::rgb mapping. This reveals the normal magenta (high τE) mix of
photoreceptors and gold (high τQ) mix of MCs. B: Glutathione (J), cytosolic retinal binding protein (CRALBP) and rod opsin (1D4) in a J.CRALBP.1D4::rgb mapping. This segments
the normal retina into spectrally distinct RPE, outer nuclear layer, neural, and MC compartments. Sample metadata: Sprague-Dawley
(SD) Rat, age 60 day, animal #P60–1L-0, left eye, no LX, bloc code 6484, slide code 5251.
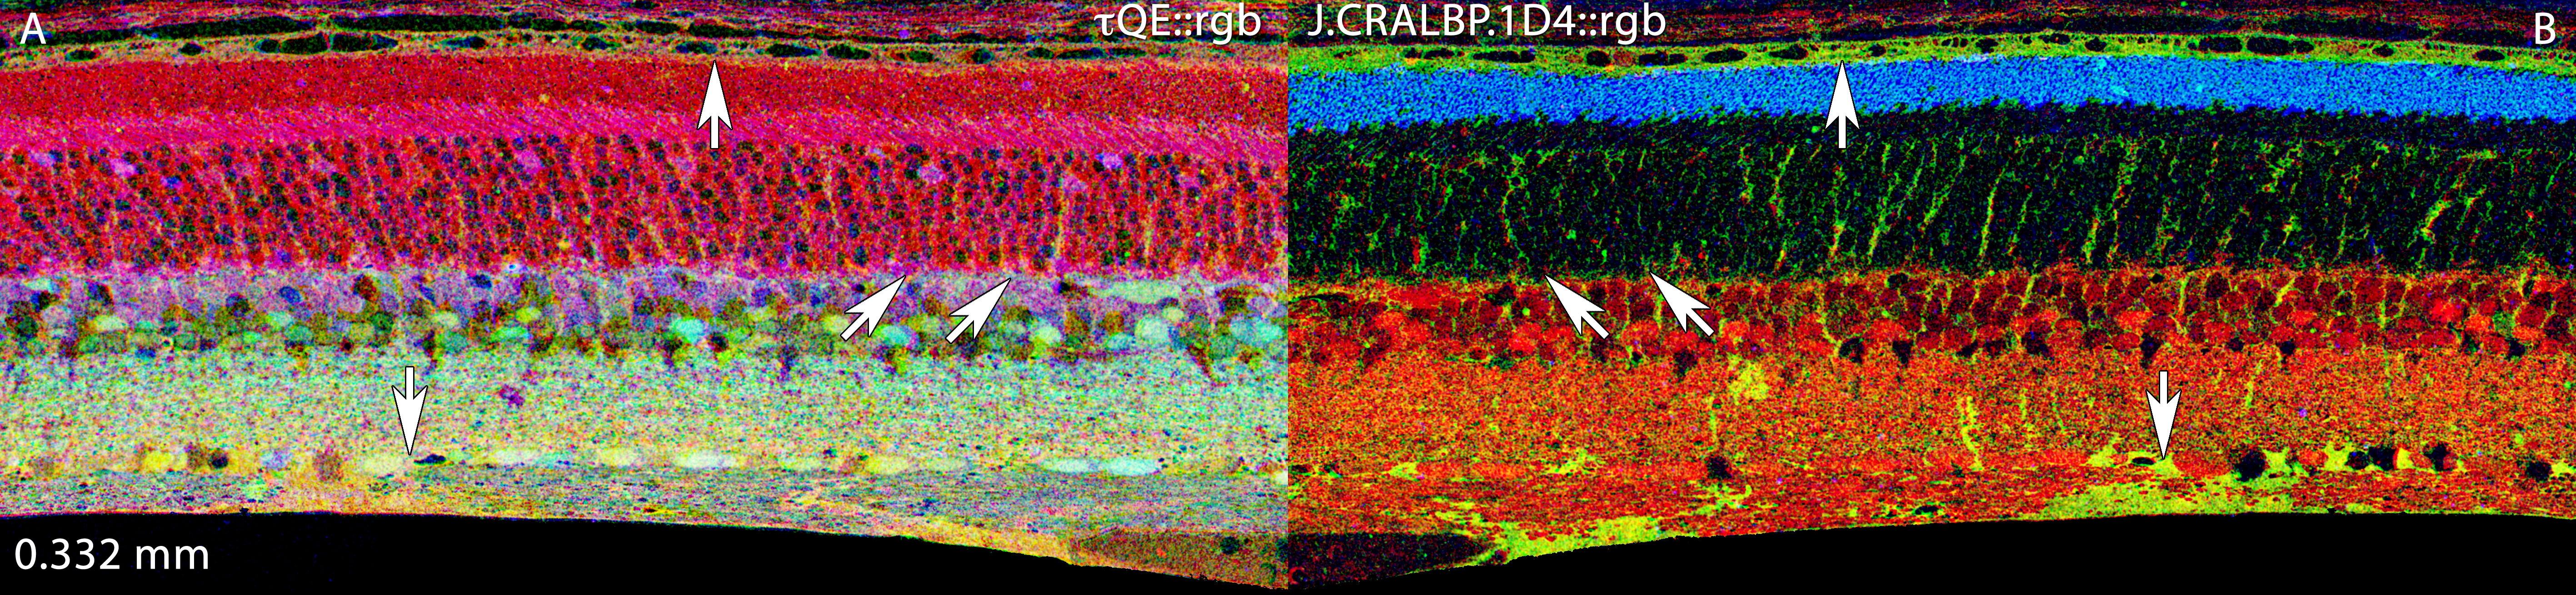
 Figure 3 of
Marc, Mol Vis 2008; 14:782-805.
Figure 3 of
Marc, Mol Vis 2008; 14:782-805.