Figure 2. Basic molecular signatures in the normal albino rat retina. Visualization: Quantitative gray-scale images displayed as intensity
in mirror-image pairs (AB, CD, EF, GH). Up arrows, retinal pigment epithelium (RPE); down arrows, Müller cell (MC) end feet;
oblique arrows mark the border of the outer nuclear and outer plexiform layers. Panels are 0.332 mm wide. A: Aspartate is high in the RPE, in cone photoreceptors and various neurons of the neural retina but low in rods. B: Glutamate levels are high in neurons and lower in MC. C: Glutathione levels are high in the RPE and MCs, but very low in photoreceptors. D: Glutamine is high in all cells, but especially MCs. E: Taurine is high in the RPE, photoreceptors and MCs, and somewhat lower in neurons. F: cytosolic retinal binding protein (CRALBP) is expressed throughout MCs and the RPE, with significant levels in the outer
segment layer. G, H: Mirror image pairs of rod opsin signals visualized with mAb rhodopsin 1D4. Note the extremely low somatic levels of rod opsin.
Sample metadata: Sprague-Dawley (SD) Rat, age 60 d, animal #P60–1L-0, left eye, no LX, bloc code 6484, slide code 5251.
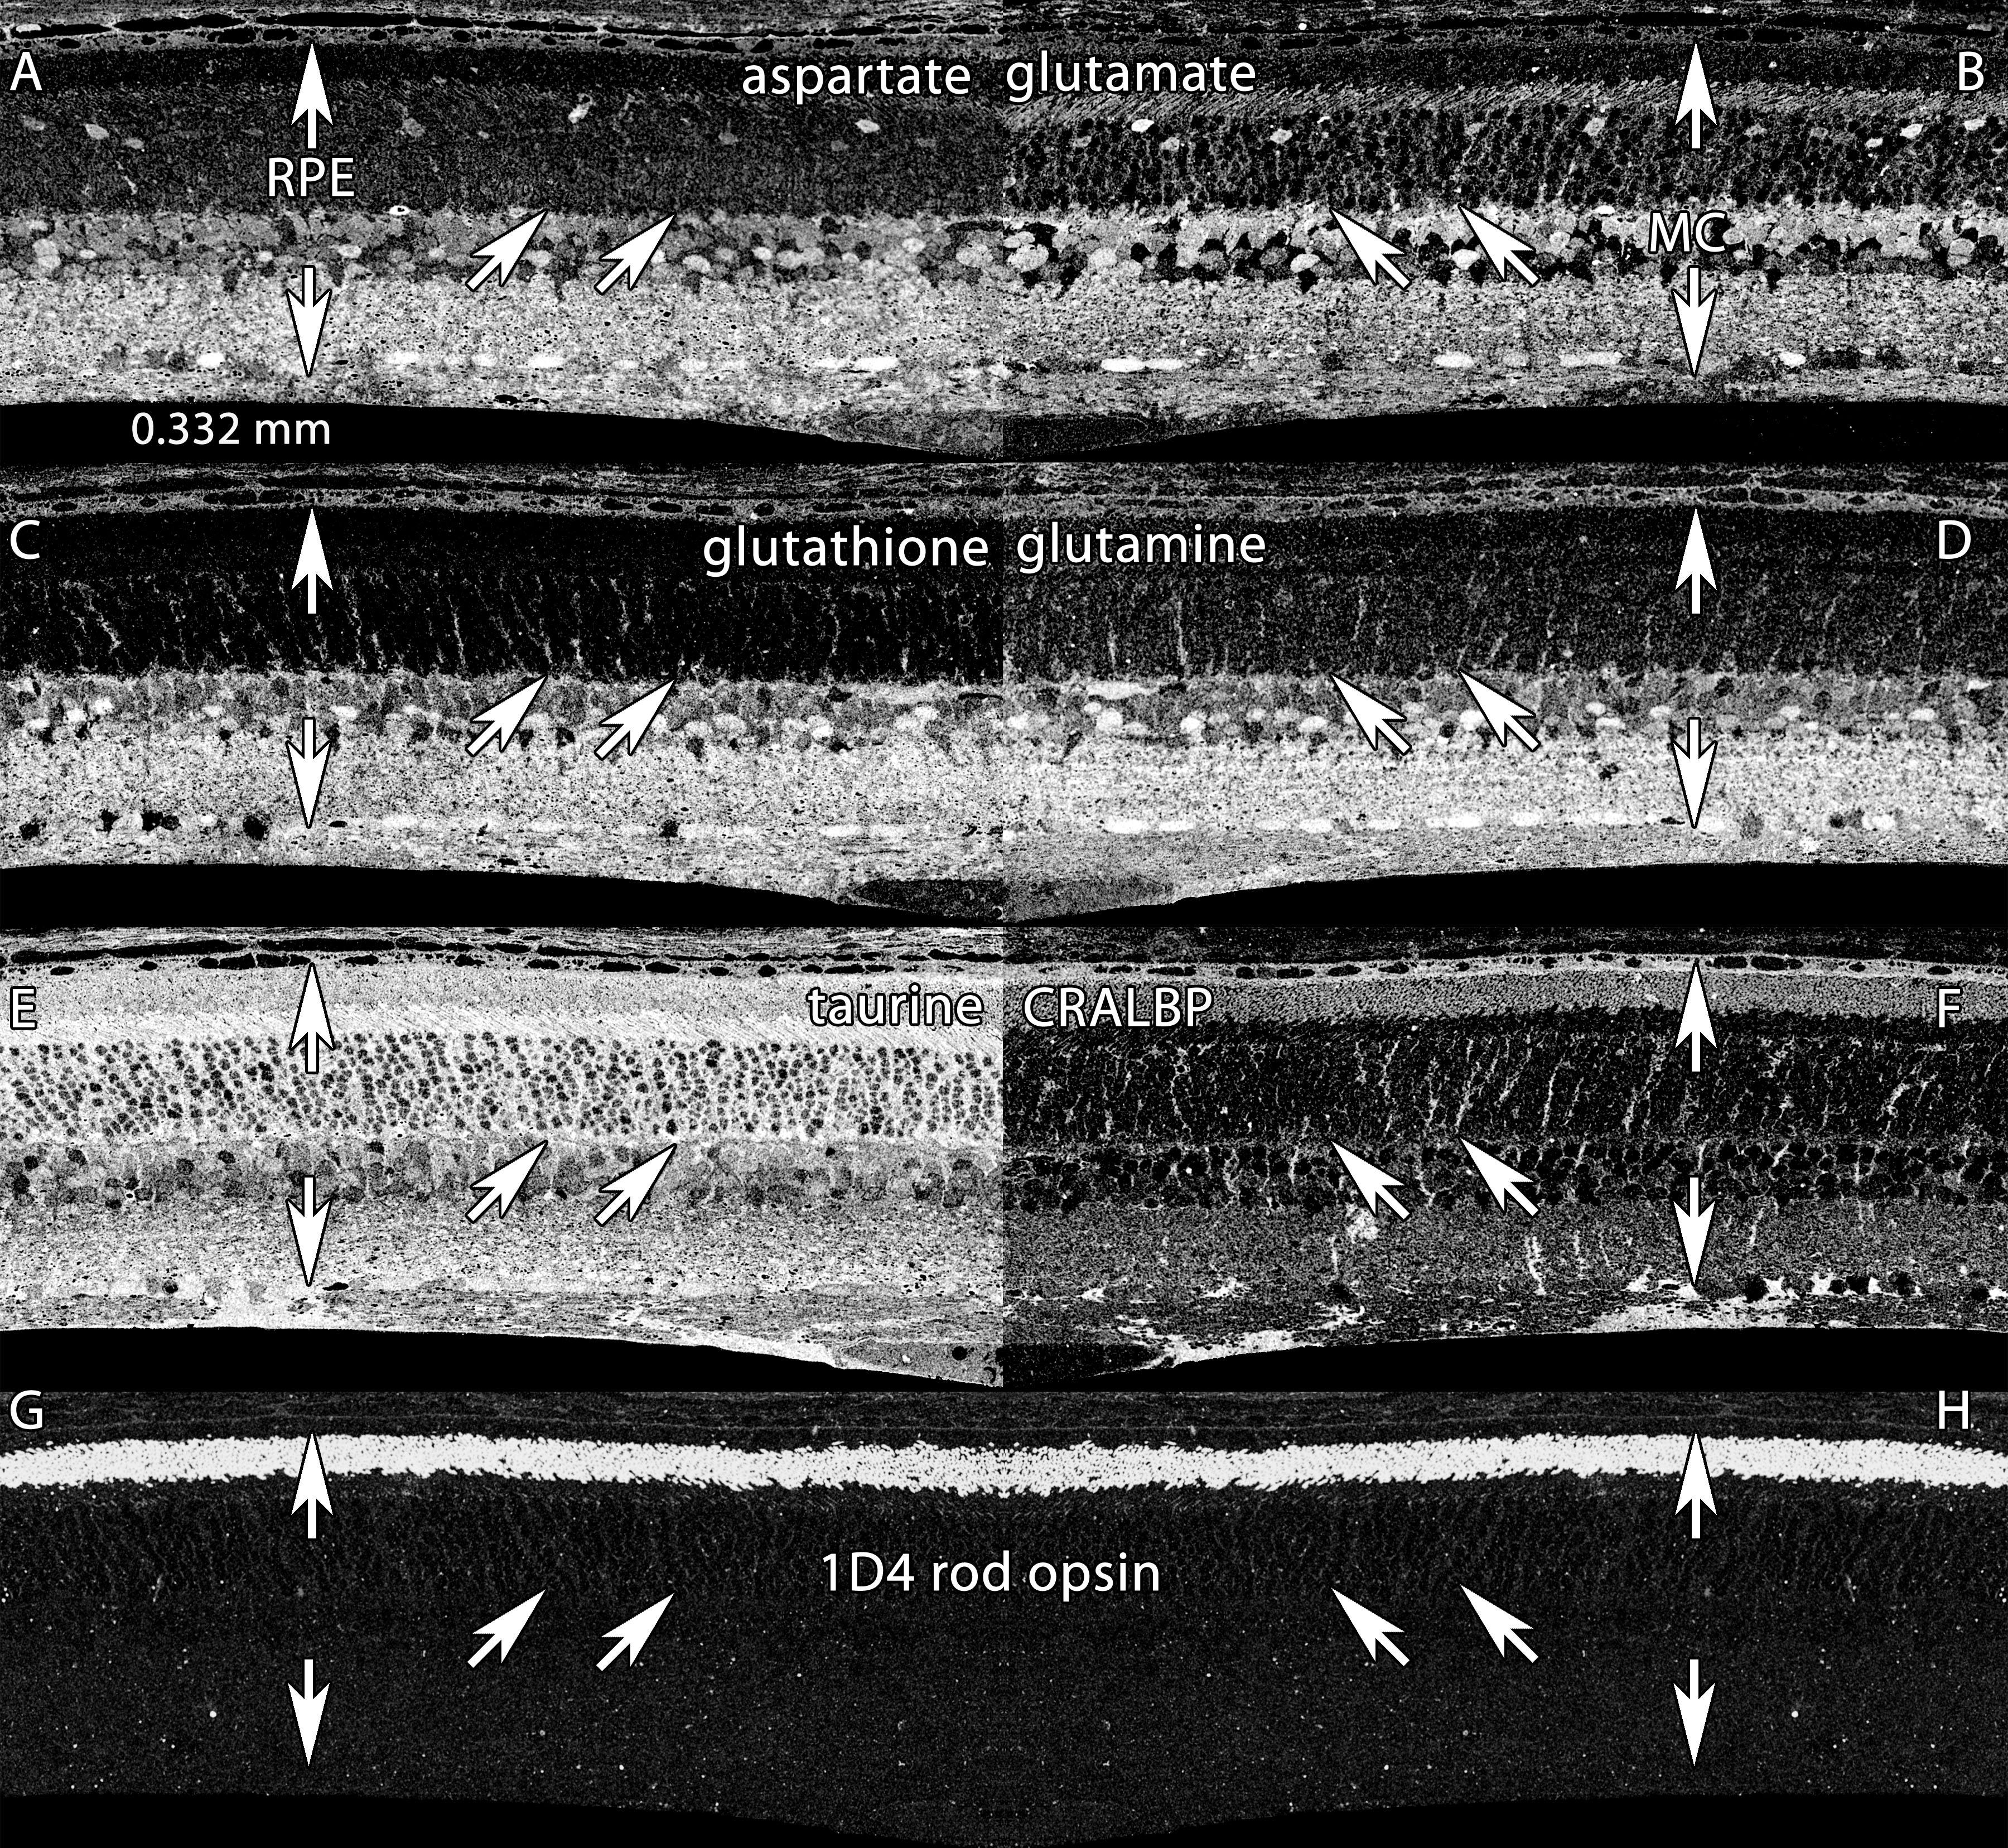
 Figure 2 of
Marc, Mol Vis 2008; 14:782-805.
Figure 2 of
Marc, Mol Vis 2008; 14:782-805.