Figure 18. Complex Müller cell phenotypes
in light induced retinal damage. The traces represent aggregate
chronologic changes in mean concentrations of taurine, glutamine, and
glutamate (the τQE signature at top) and arginine and cytosolic retinal
binding protein (CRALBP) bottom. See text.
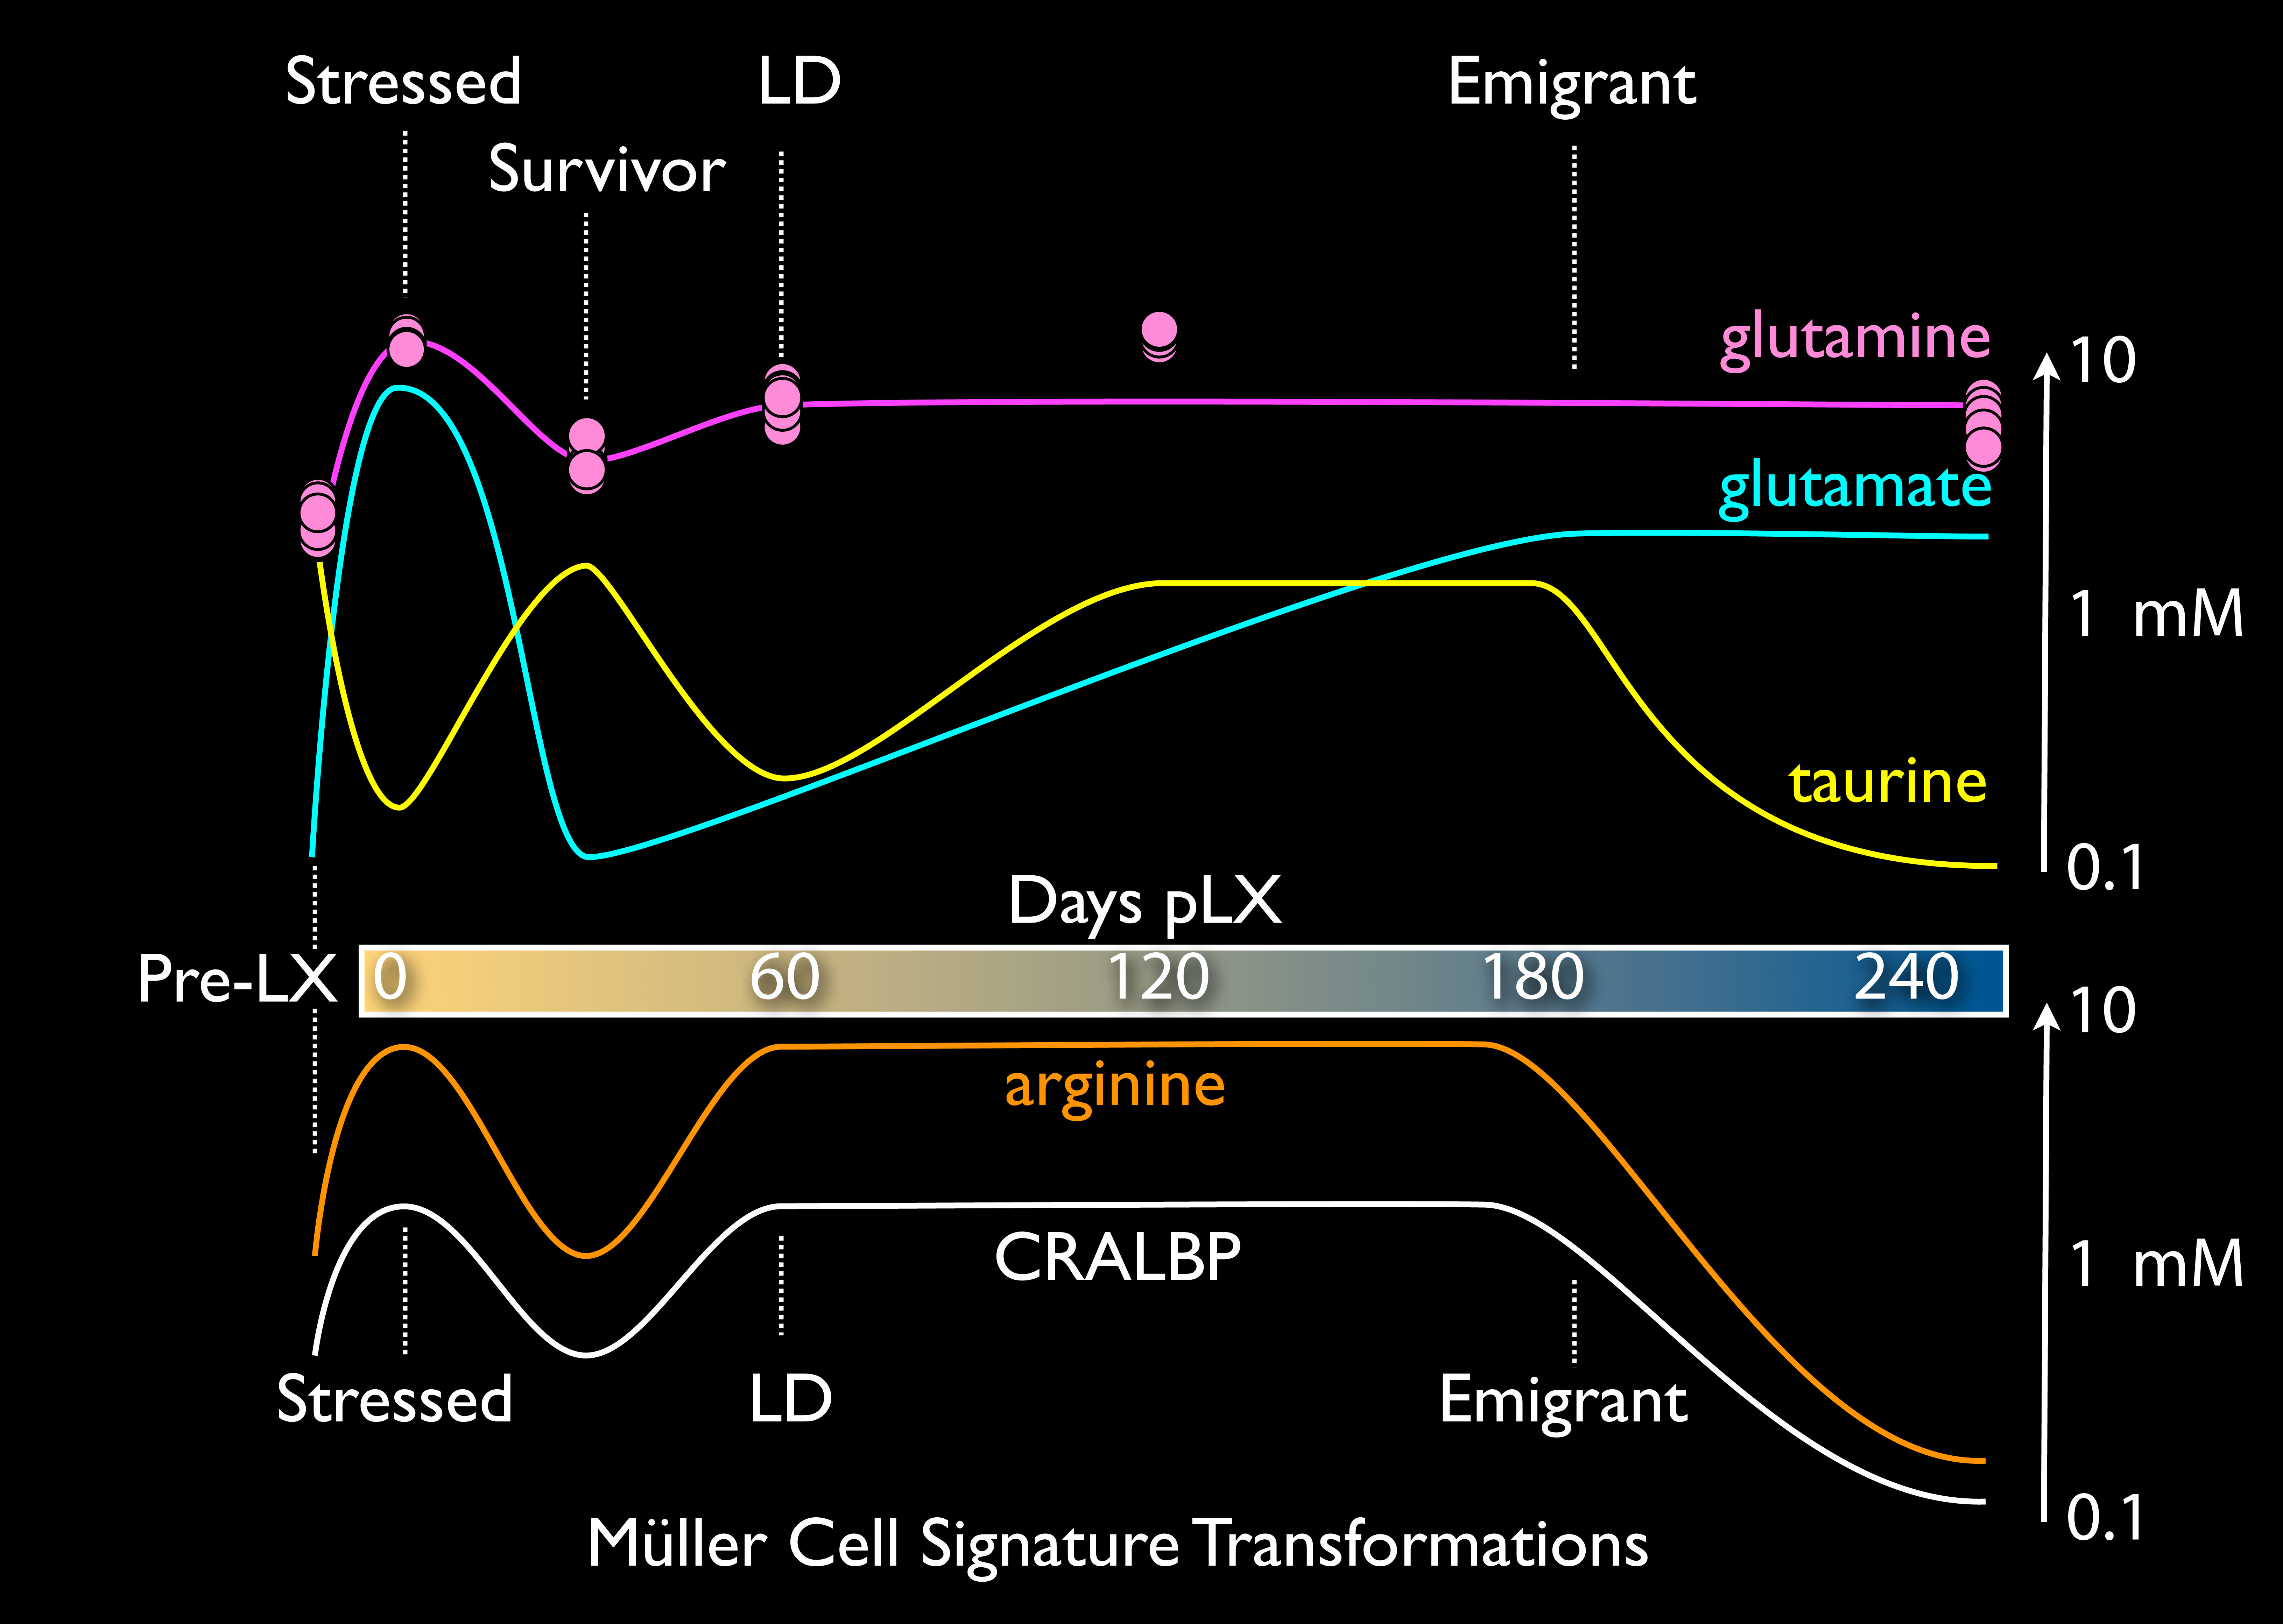
 Figure 18 of Marc, Mol Vis 2008; 14:782-805.