Figure 17. Microneuromas in light induced retinal damage at pLX 60, 120 and 240. Visualization: computational molecular phenotyping (CMP)
images displayed as mirrored (AB, EF) or individual (CD) intensity channels. Down arrows, remnant retina-choroid interface;
angled arrows, cell migration; ch, fluid channels; ovals, microneuromas. A: γGE::rgb mapping at pLX 60 reveals small microneuromas formed in part by amacrine cell neurites in the distal retina. Each
panel is 0.256 mm wide.B: τQE::rgb mapping shows that the microneuromas are embedded in the distal seal region far from the inner plexiform layer.C, D: γGE::rgb mapping at pLX 120 displays larger microneuromas above (C) and within (D) the inner nuclear layer. Each panel is 0.256 mm wide.E. γGE::rgb mapping at pLX 240 reveals small microneuromas flanking
a column of migrating neurons. Boxes highlight two misplaced glycinergic amacrine cells. Each panel is 0.170 mm wide.F. τQE::rgb mapping at pLX 240 reveals the complex cell types forming the migration column and that microneuromas are again
close to the distal seal.
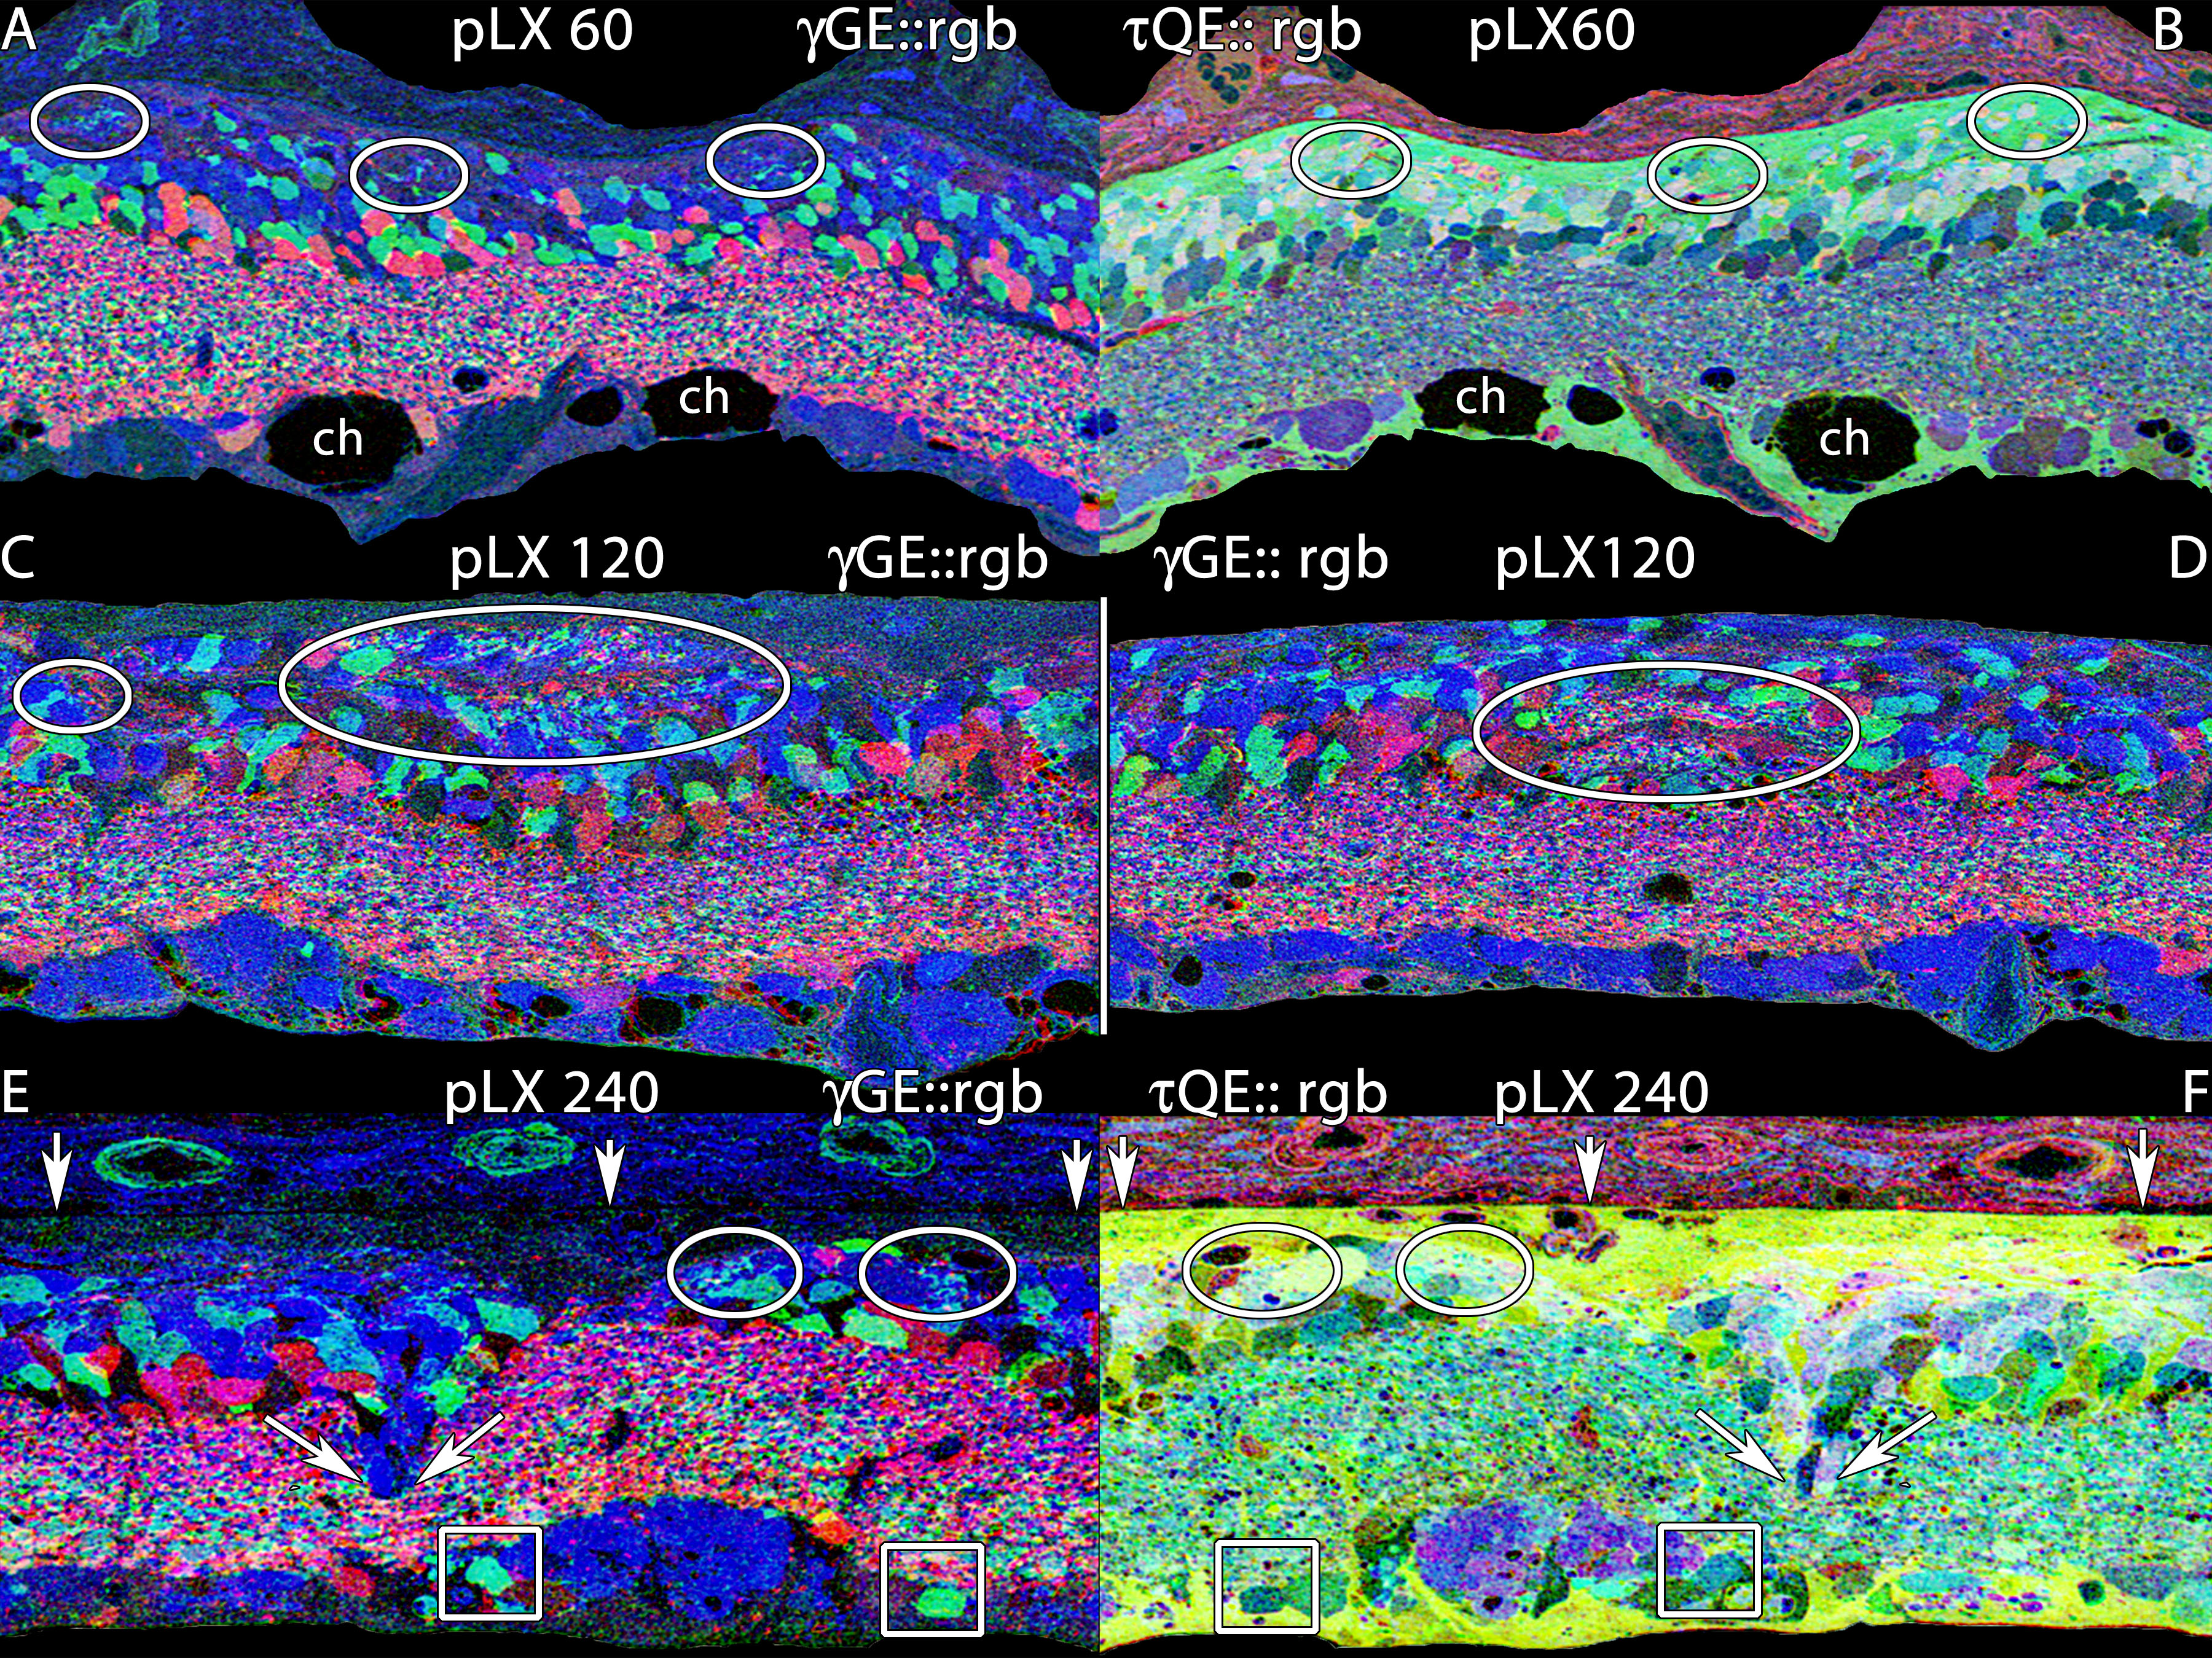
 Figure 17 of
Marc, Mol Vis 2008; 14:782-805.
Figure 17 of
Marc, Mol Vis 2008; 14:782-805.