Figure 16. Human geographic atrophy mimics the light induced retinal damage phenotype. Visualization: Quantitative gray-scale images
of cytosolic retinal binding protein (CRALBP) signals displayed as intensity. Boxes denote decimated zones; arrowheads indicate
the uneven choroid-retina interface. Asters indicate the sharp survivor-decimated retina border. A: CRALBP signals displays three patches of retinal pigment epithelium (RPE) over survivor zones, with decimated retina between.
Panel width 1.822 mm. B, C: CRALBP signals are elevated in presumed remnant Müller cells of the seal region (aster), but the zone between is severely
depleted of cells and the choroid-retina interface is uneven. Panel widths 0.508 mm.Sample metadata: Human age related macular
degenerations (AMD, geographic atrophy); FFB# 9331; age at harvest 81 y, post-mortem delay 9 h, fixation 1% formaldehyde -
2% glutaraldehyde - 0.1 M PB, 3 mm perimacular trephine, bloc code 8771, slide code 5350.
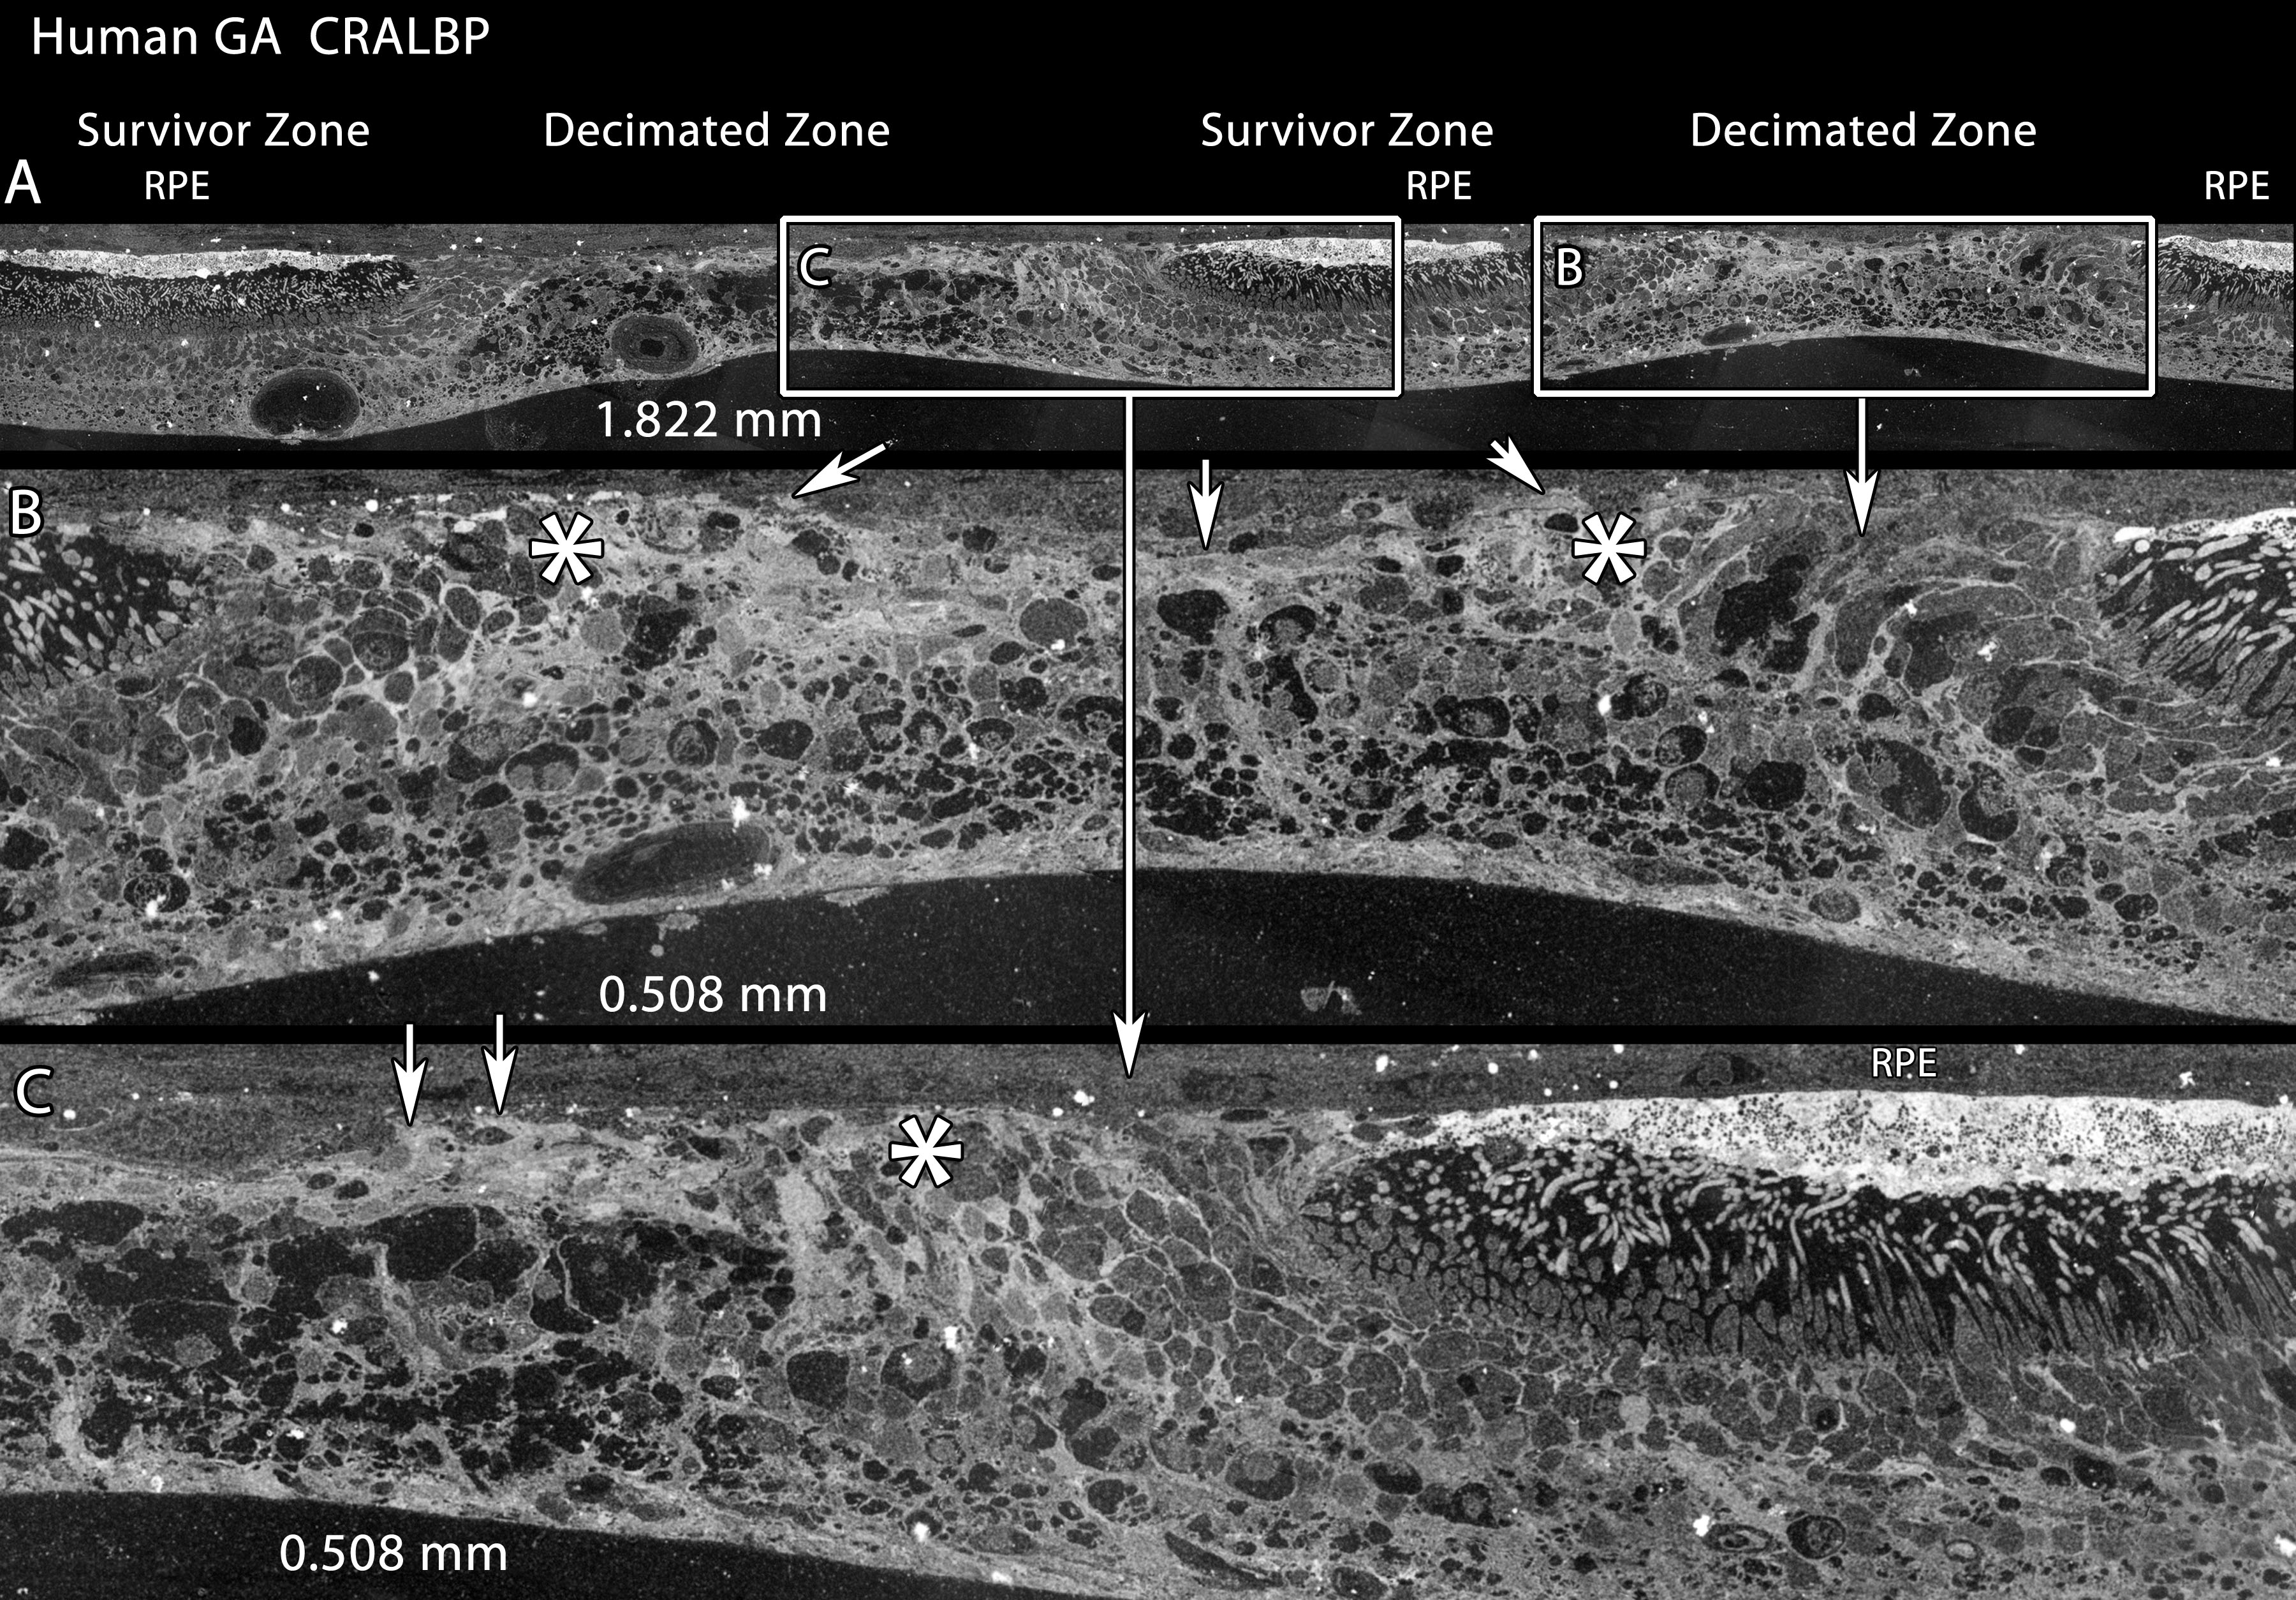
 Figure 16 of
Marc, Mol Vis 2008; 14:782-805.
Figure 16 of
Marc, Mol Vis 2008; 14:782-805.