Figure 15. Arginine and glutamine profiles across the Survivor-light damage (LD)-decimation gradient. Visualization: Quantitative gray-scale
mirrored images of molecular signals displayed as intensity. Boxes denotes aggregates of emigrant glutamine+ cells and processes
in the decimated zone. Downward arrows mark the choroid-retinal pigment epithelium (RPE, AB) or choroid-retina interface (CDEF).
Upward arrows marks the external limiting membrane. Circles mark high-arginine ganglion cells. Each panel is 0.241 mm wide.
A: Arginine levels in survivor retina are modest and mostly in Müller cells and some amacrine cells, similar to normal retina.
B: Glutamine levels levels in survivor retina are high in Müller cells, the RPE and many other cell types, similar to normal
retina. C: Arginine levels in the LD zone are elevated in Müller cells associated with the distal seal. D: Glutamine levels in the LD zone are elevated in Müller cells associated with the distal seal. E: Arginine levels in the decimated zone and emigrant cells collapse in Müller cells (box) but are elevated in the nuclei of
remnant ganglion cells (circle). F: Glutamine levels in the decimated zone drop but remain high in emigrant Müller cells (box). Levels are modest in the nuclei
of remnant ganglion cells (circle). Sample metadata: SD Rat, age at LX 60 d, animal #P180–2R-48, right eye, 48 h LX, harvested
at 120 days pLX, bloc code 6627, slide code 5228.
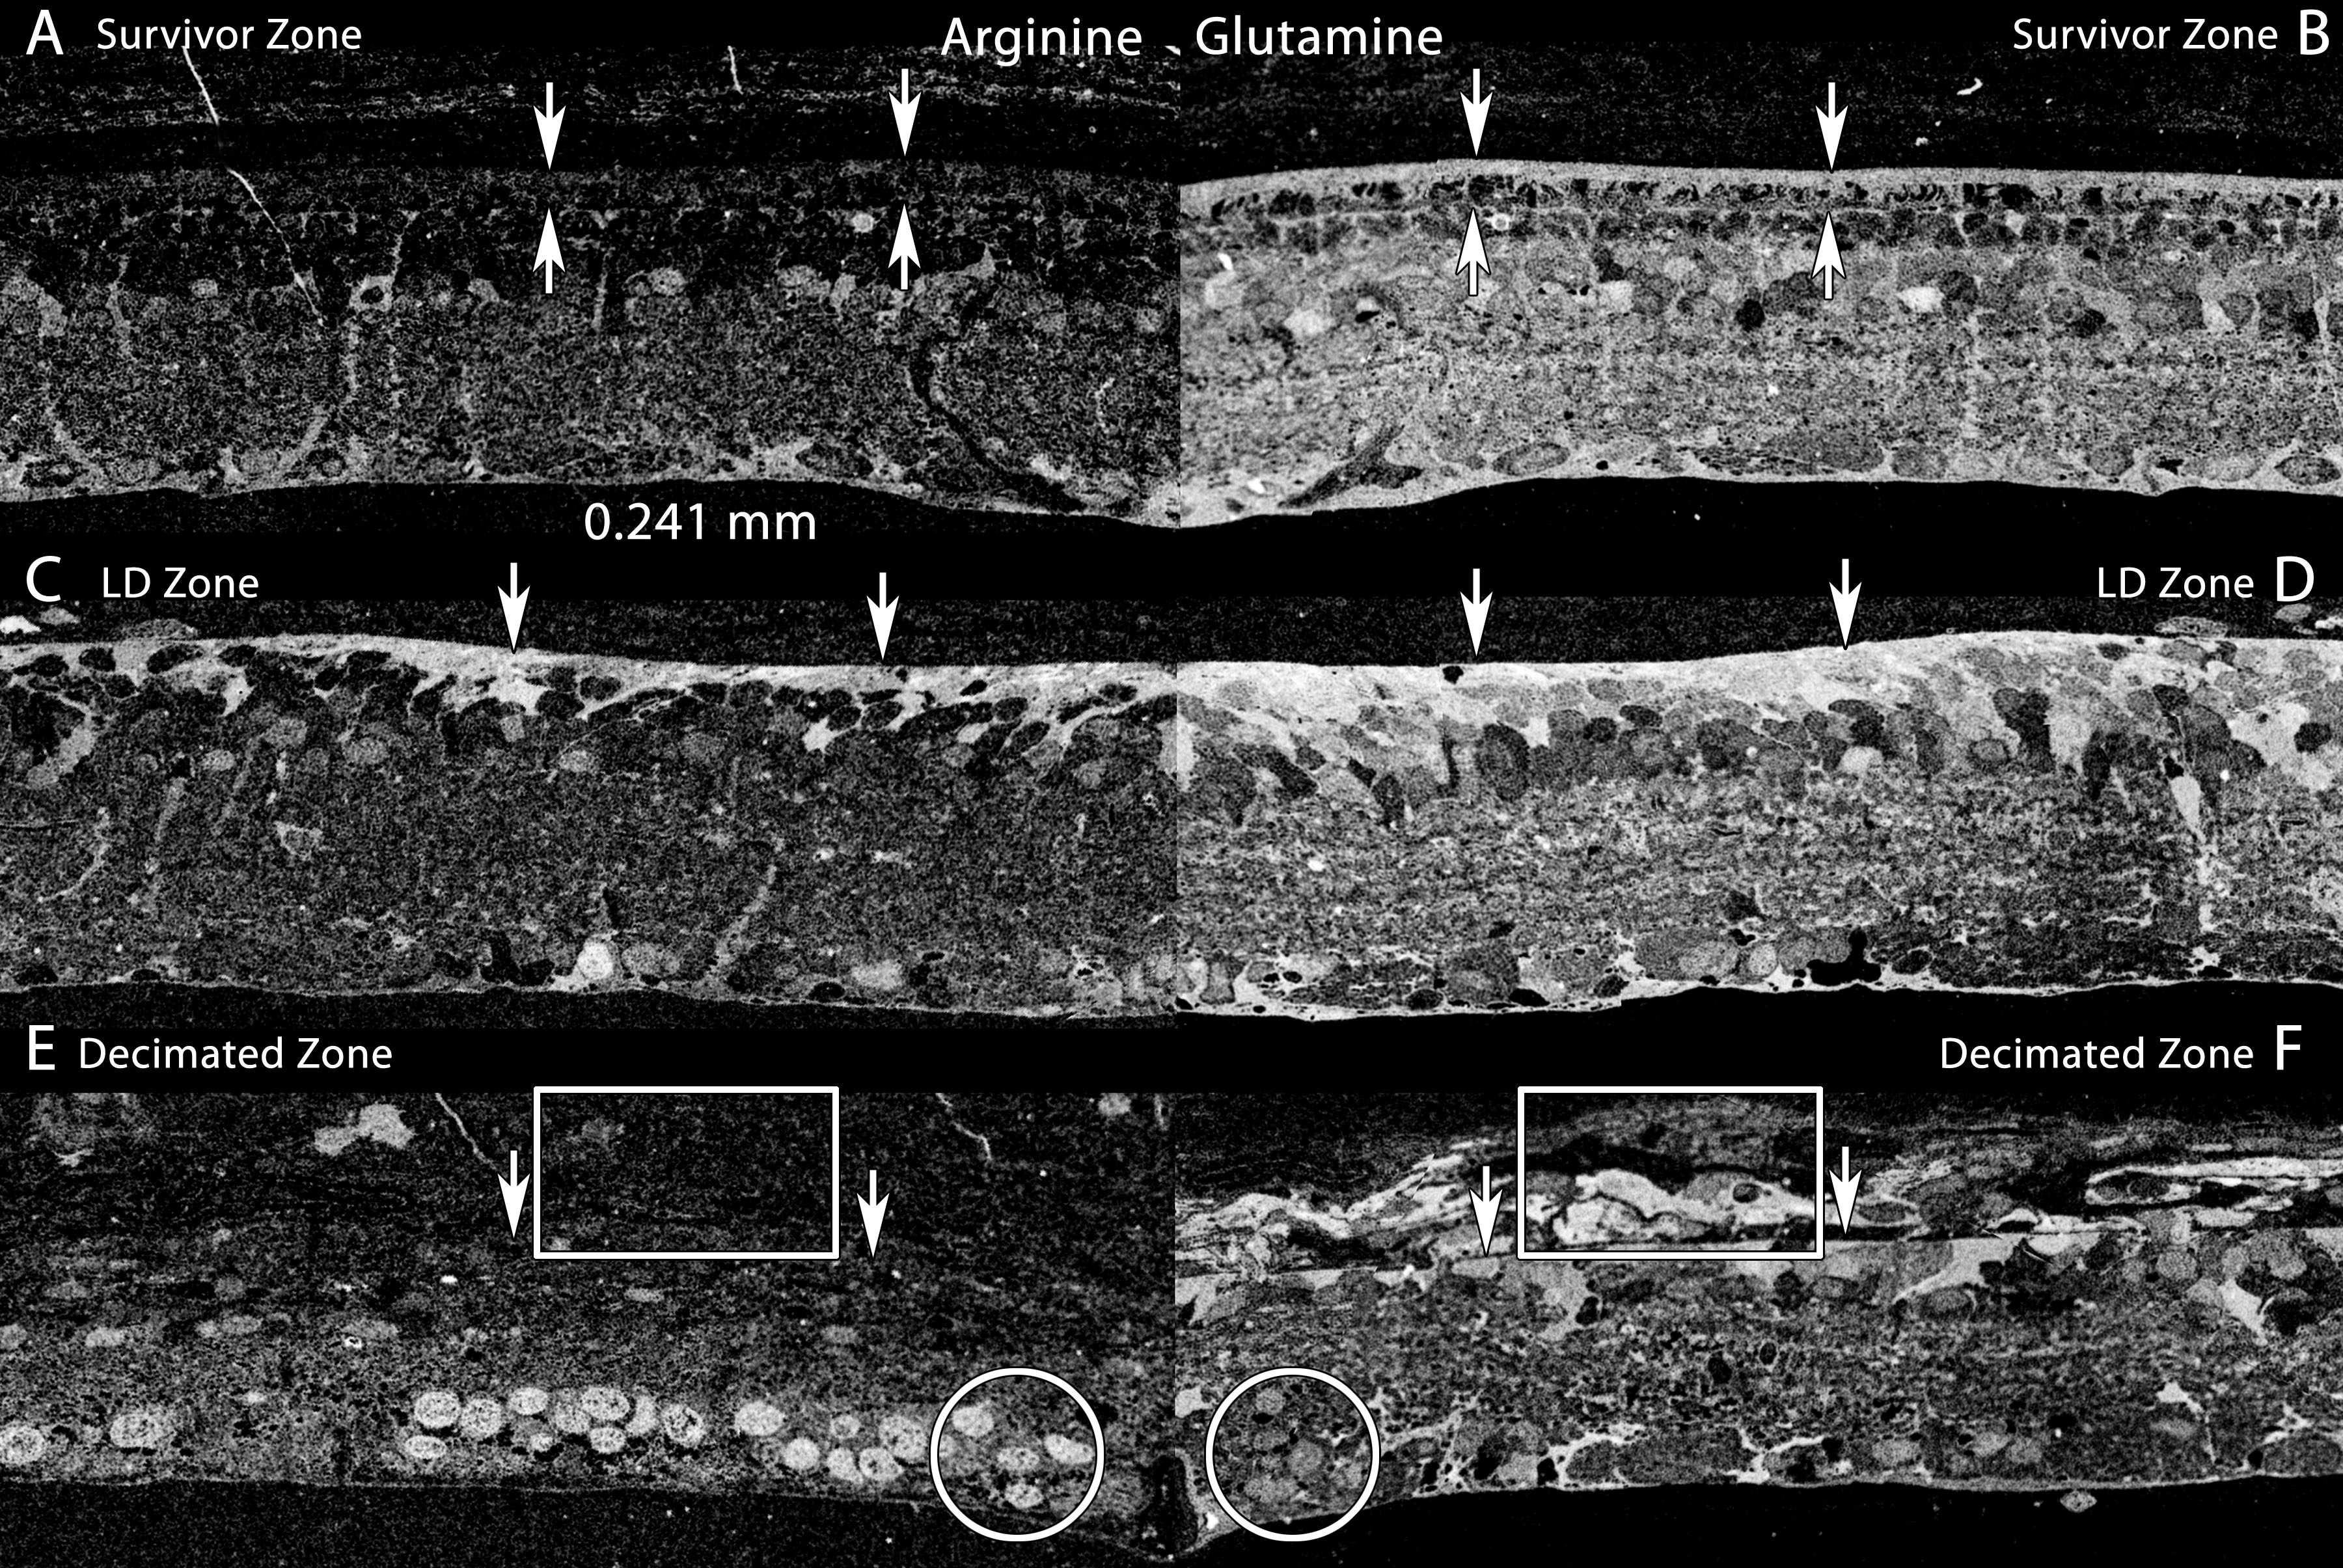
 Figure 15 of
Marc, Mol Vis 2008; 14:782-805.
Figure 15 of
Marc, Mol Vis 2008; 14:782-805.