Figure 14. γ-aminobutyric acid (GABA) profiles across the survivor-light damage (LD)-Decimation gradient. Visualization: Quantitative
gray-scale images of GABA signals displayed as intensity. Boxes denotes large aggregates of emigrant GABA+ cells and processes
in the decimated zone. The panel is 0.779 mm wide. Note the severe loss of GABA signals in the decimation zone. Sample metadata:
SD Rat, age at LX 60 d, animal #P240–2L-24, left eye, 24 h LX, harvested at 240 days pLX, bloc code 6685, slide code 3518.
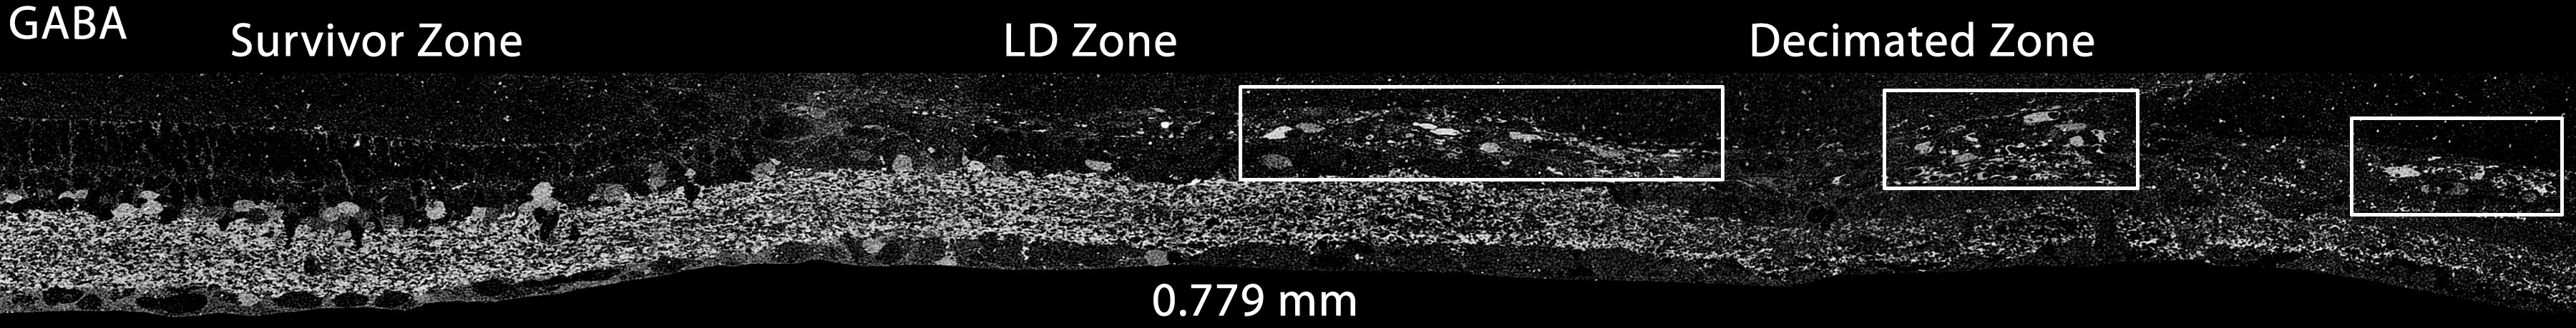
 Figure 14 of
Marc, Mol Vis 2008; 14:782-805.
Figure 14 of
Marc, Mol Vis 2008; 14:782-805.