Figure 13. Glutamine profiles across the
Survivor-light damage (LD)-Decimation gradient. Visualization:
Quantitative gray-scale images of glutamine signals displayed as
intensity. Up arrows, remnant retina-choroid interface; downward arrow
is the small high glutamine seal region. The bottom panel is 0.579 mm
wide and shows isolated glutamine gradients in retina, retinal pigment
epithelium (RPE), choroid, seal, emigrant and decimated zones. All
decimated zones show large numbers of holes (see Methods). Sample
metadata: SD Rat, age at LX 60 d, animal #P240–2L-24, left eye, 24 h
LX, harvested at 240 days pLX, bloc code 6685, slide code 3518.
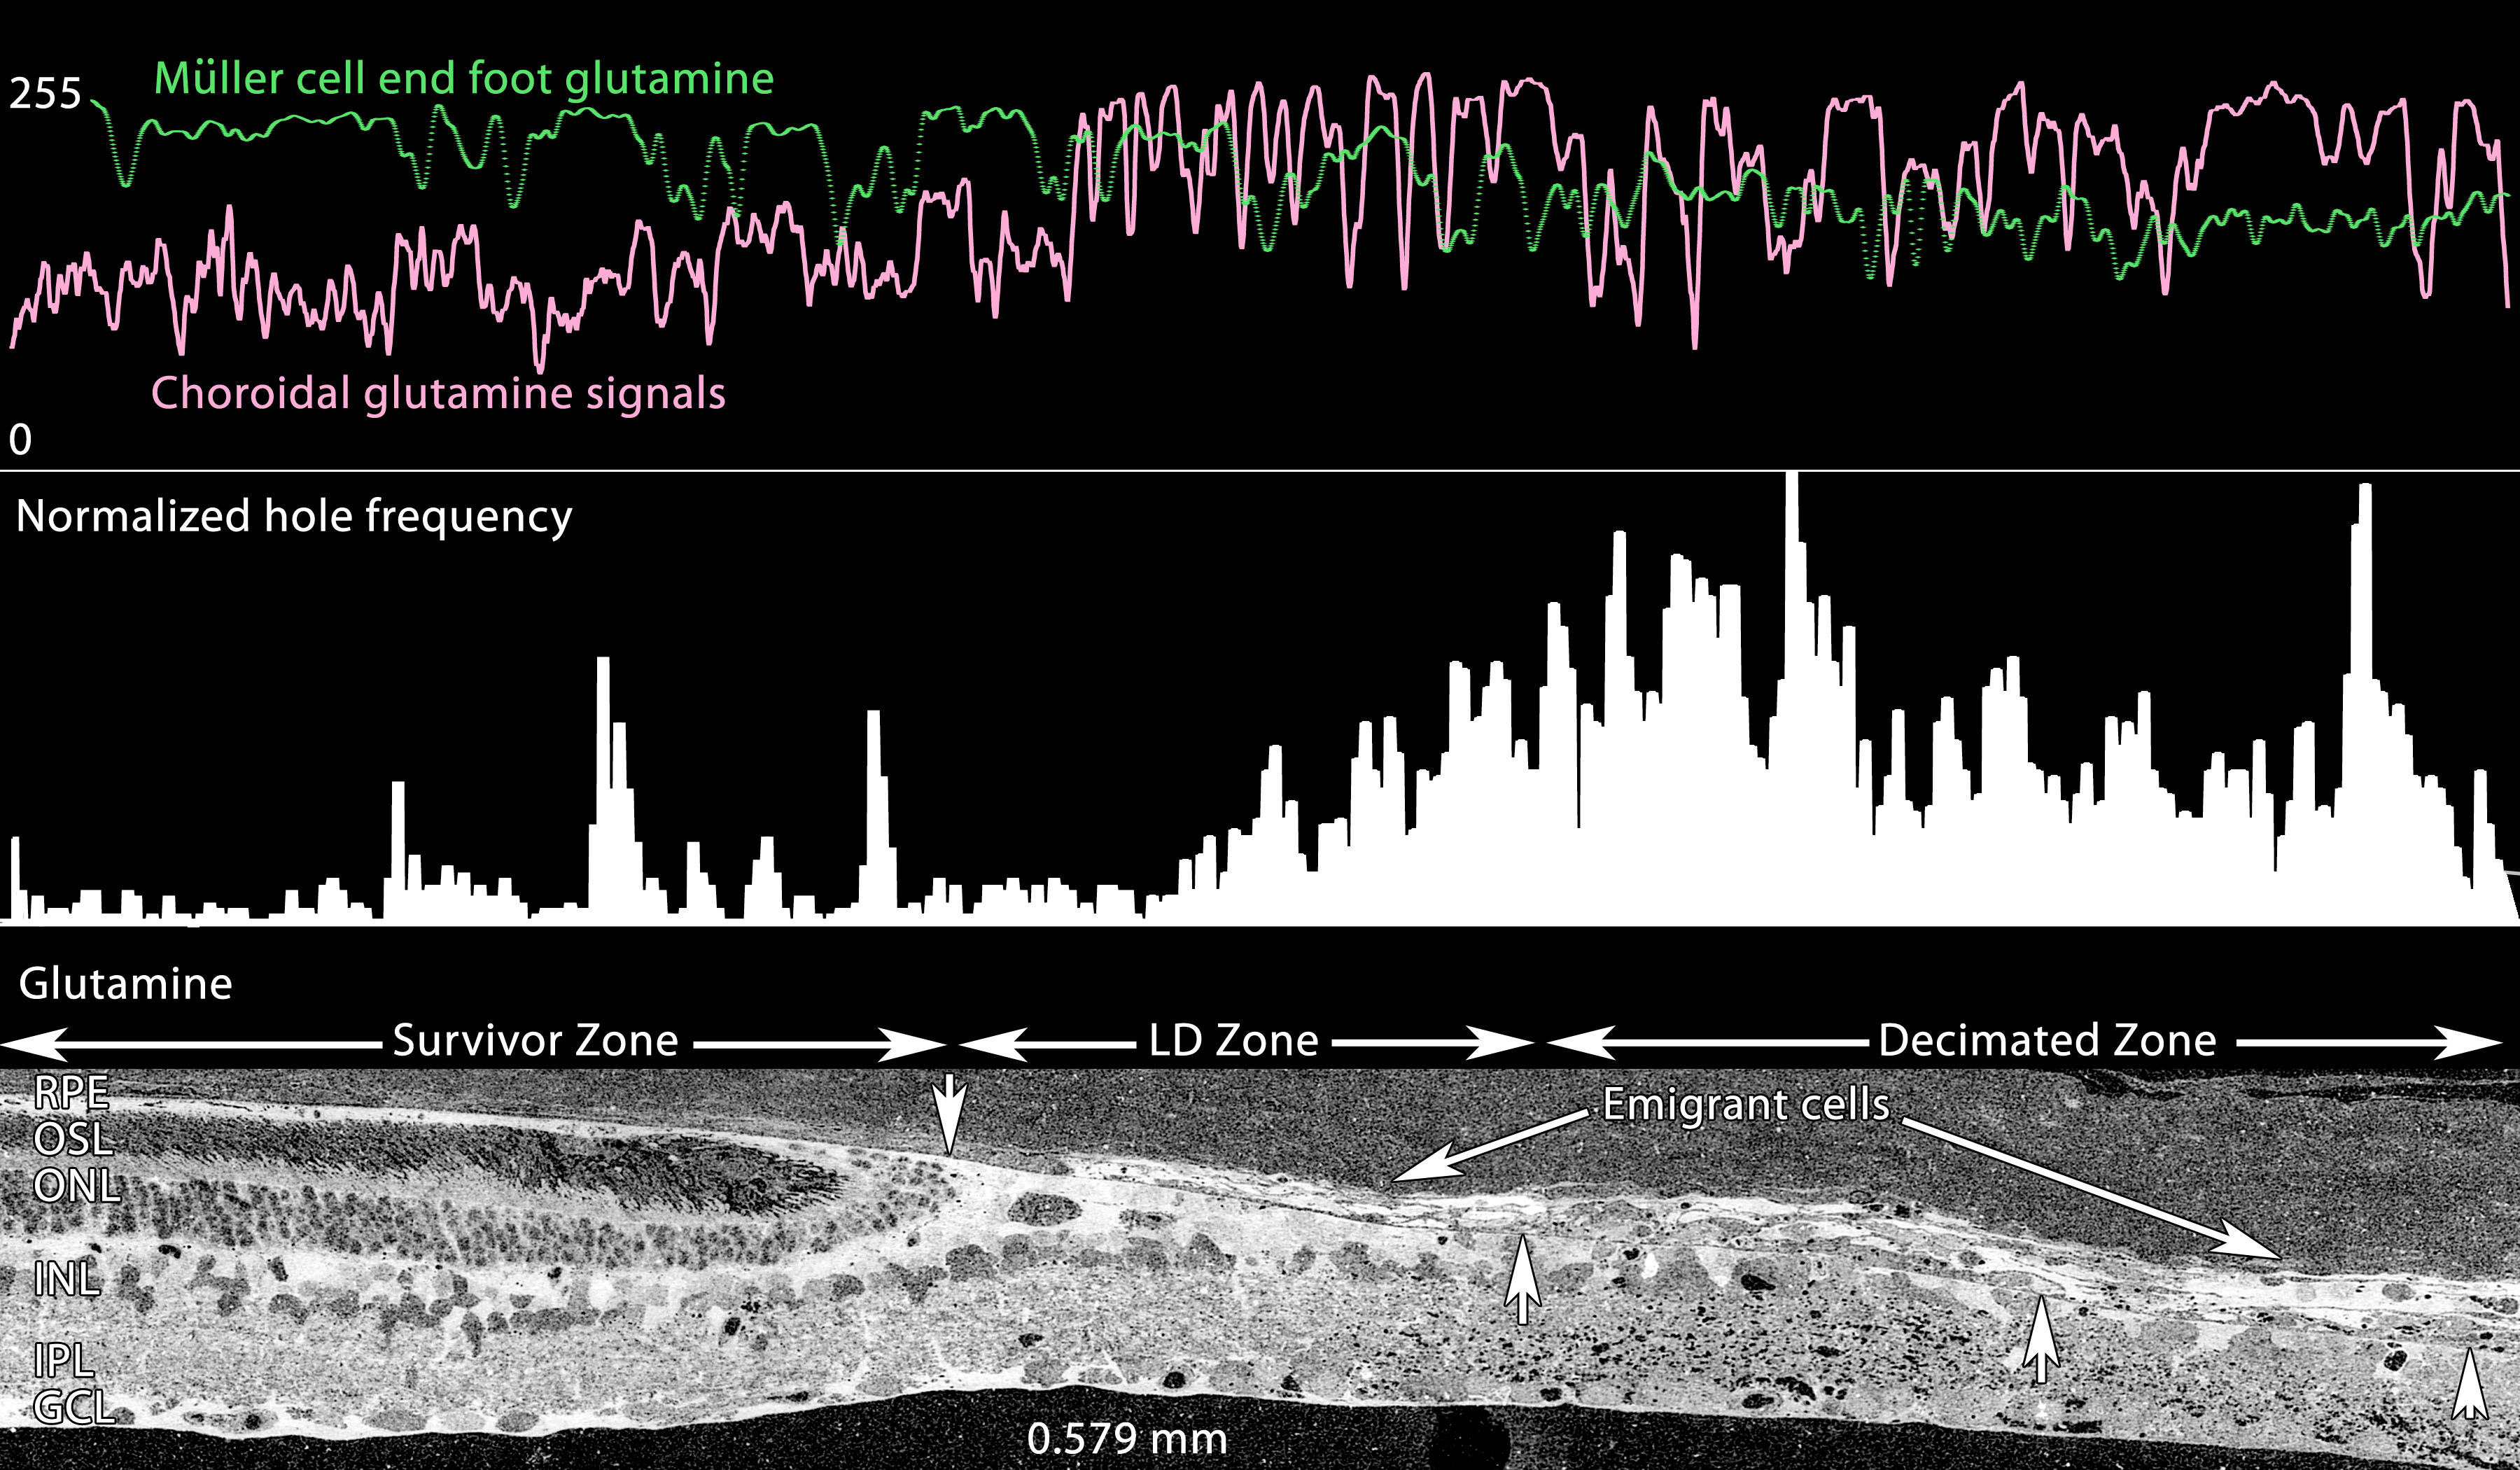
 Figure 13 of Marc, Mol Vis 2008; 14:782-805.