Figure 12. Detailed Survivor-light damage (LD)-Decimation gradient. Visualization: CMP images displayed as intensity channels. Up arrows,
remnant retina-choroid interface; oval, fluid channels. The panel is 0.600 mm wide. τQE::rgb mapping shows the roughly normal
spectral signatures of the retinal pigment epithelium (RPE), photoreceptors and neural retina, with a very small LD zone and
a massive decimated zone with weak retinal glutamine signals and large numbers of emigrant cells with high QE signatures.
Sample metadata: SD Rat, age at LX 60 d, animal #P240–2L-24, left eye, 24 h LX, harvested at 240 days pLX, bloc code 6685,
slide code 3518.
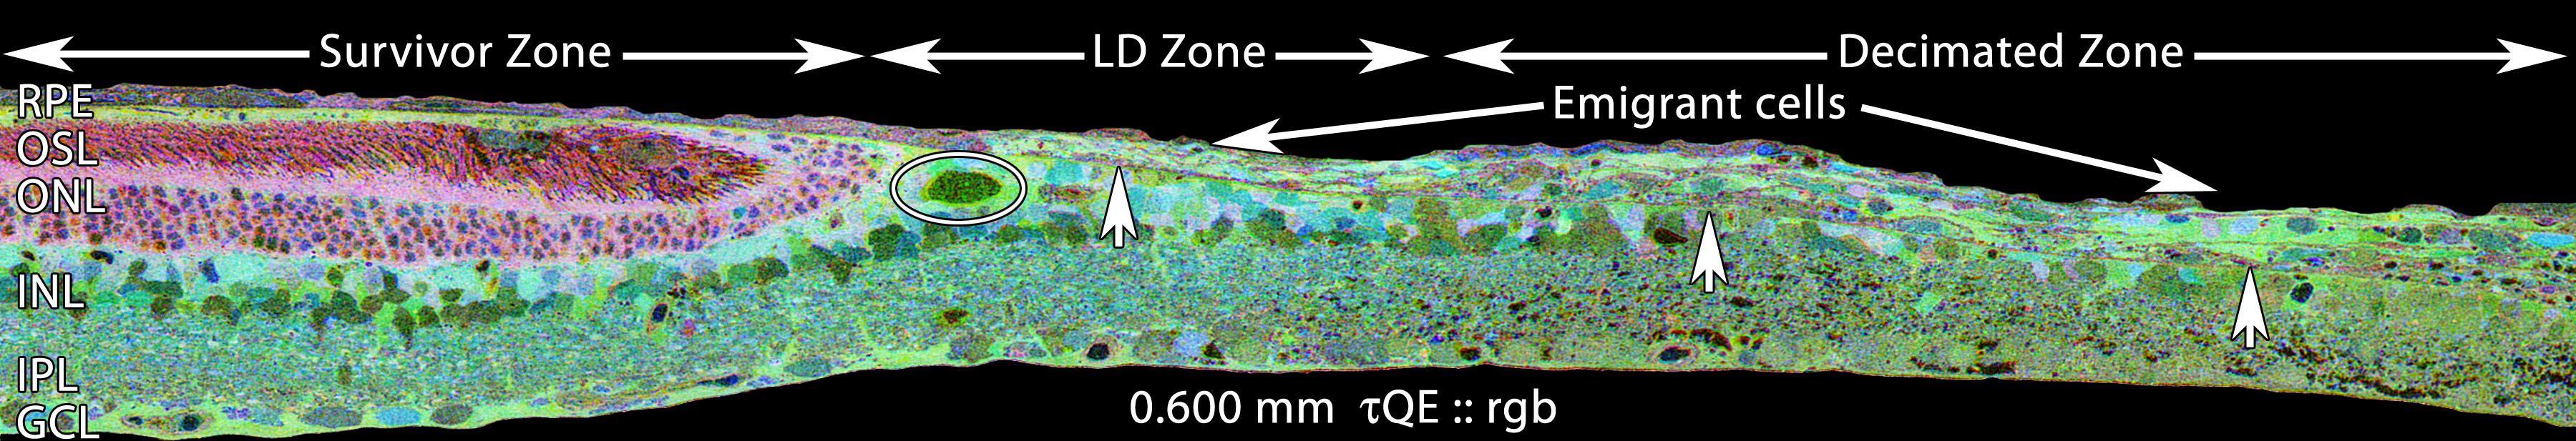
 Figure 12 of
Marc, Mol Vis 2008; 14:782-805.
Figure 12 of
Marc, Mol Vis 2008; 14:782-805.