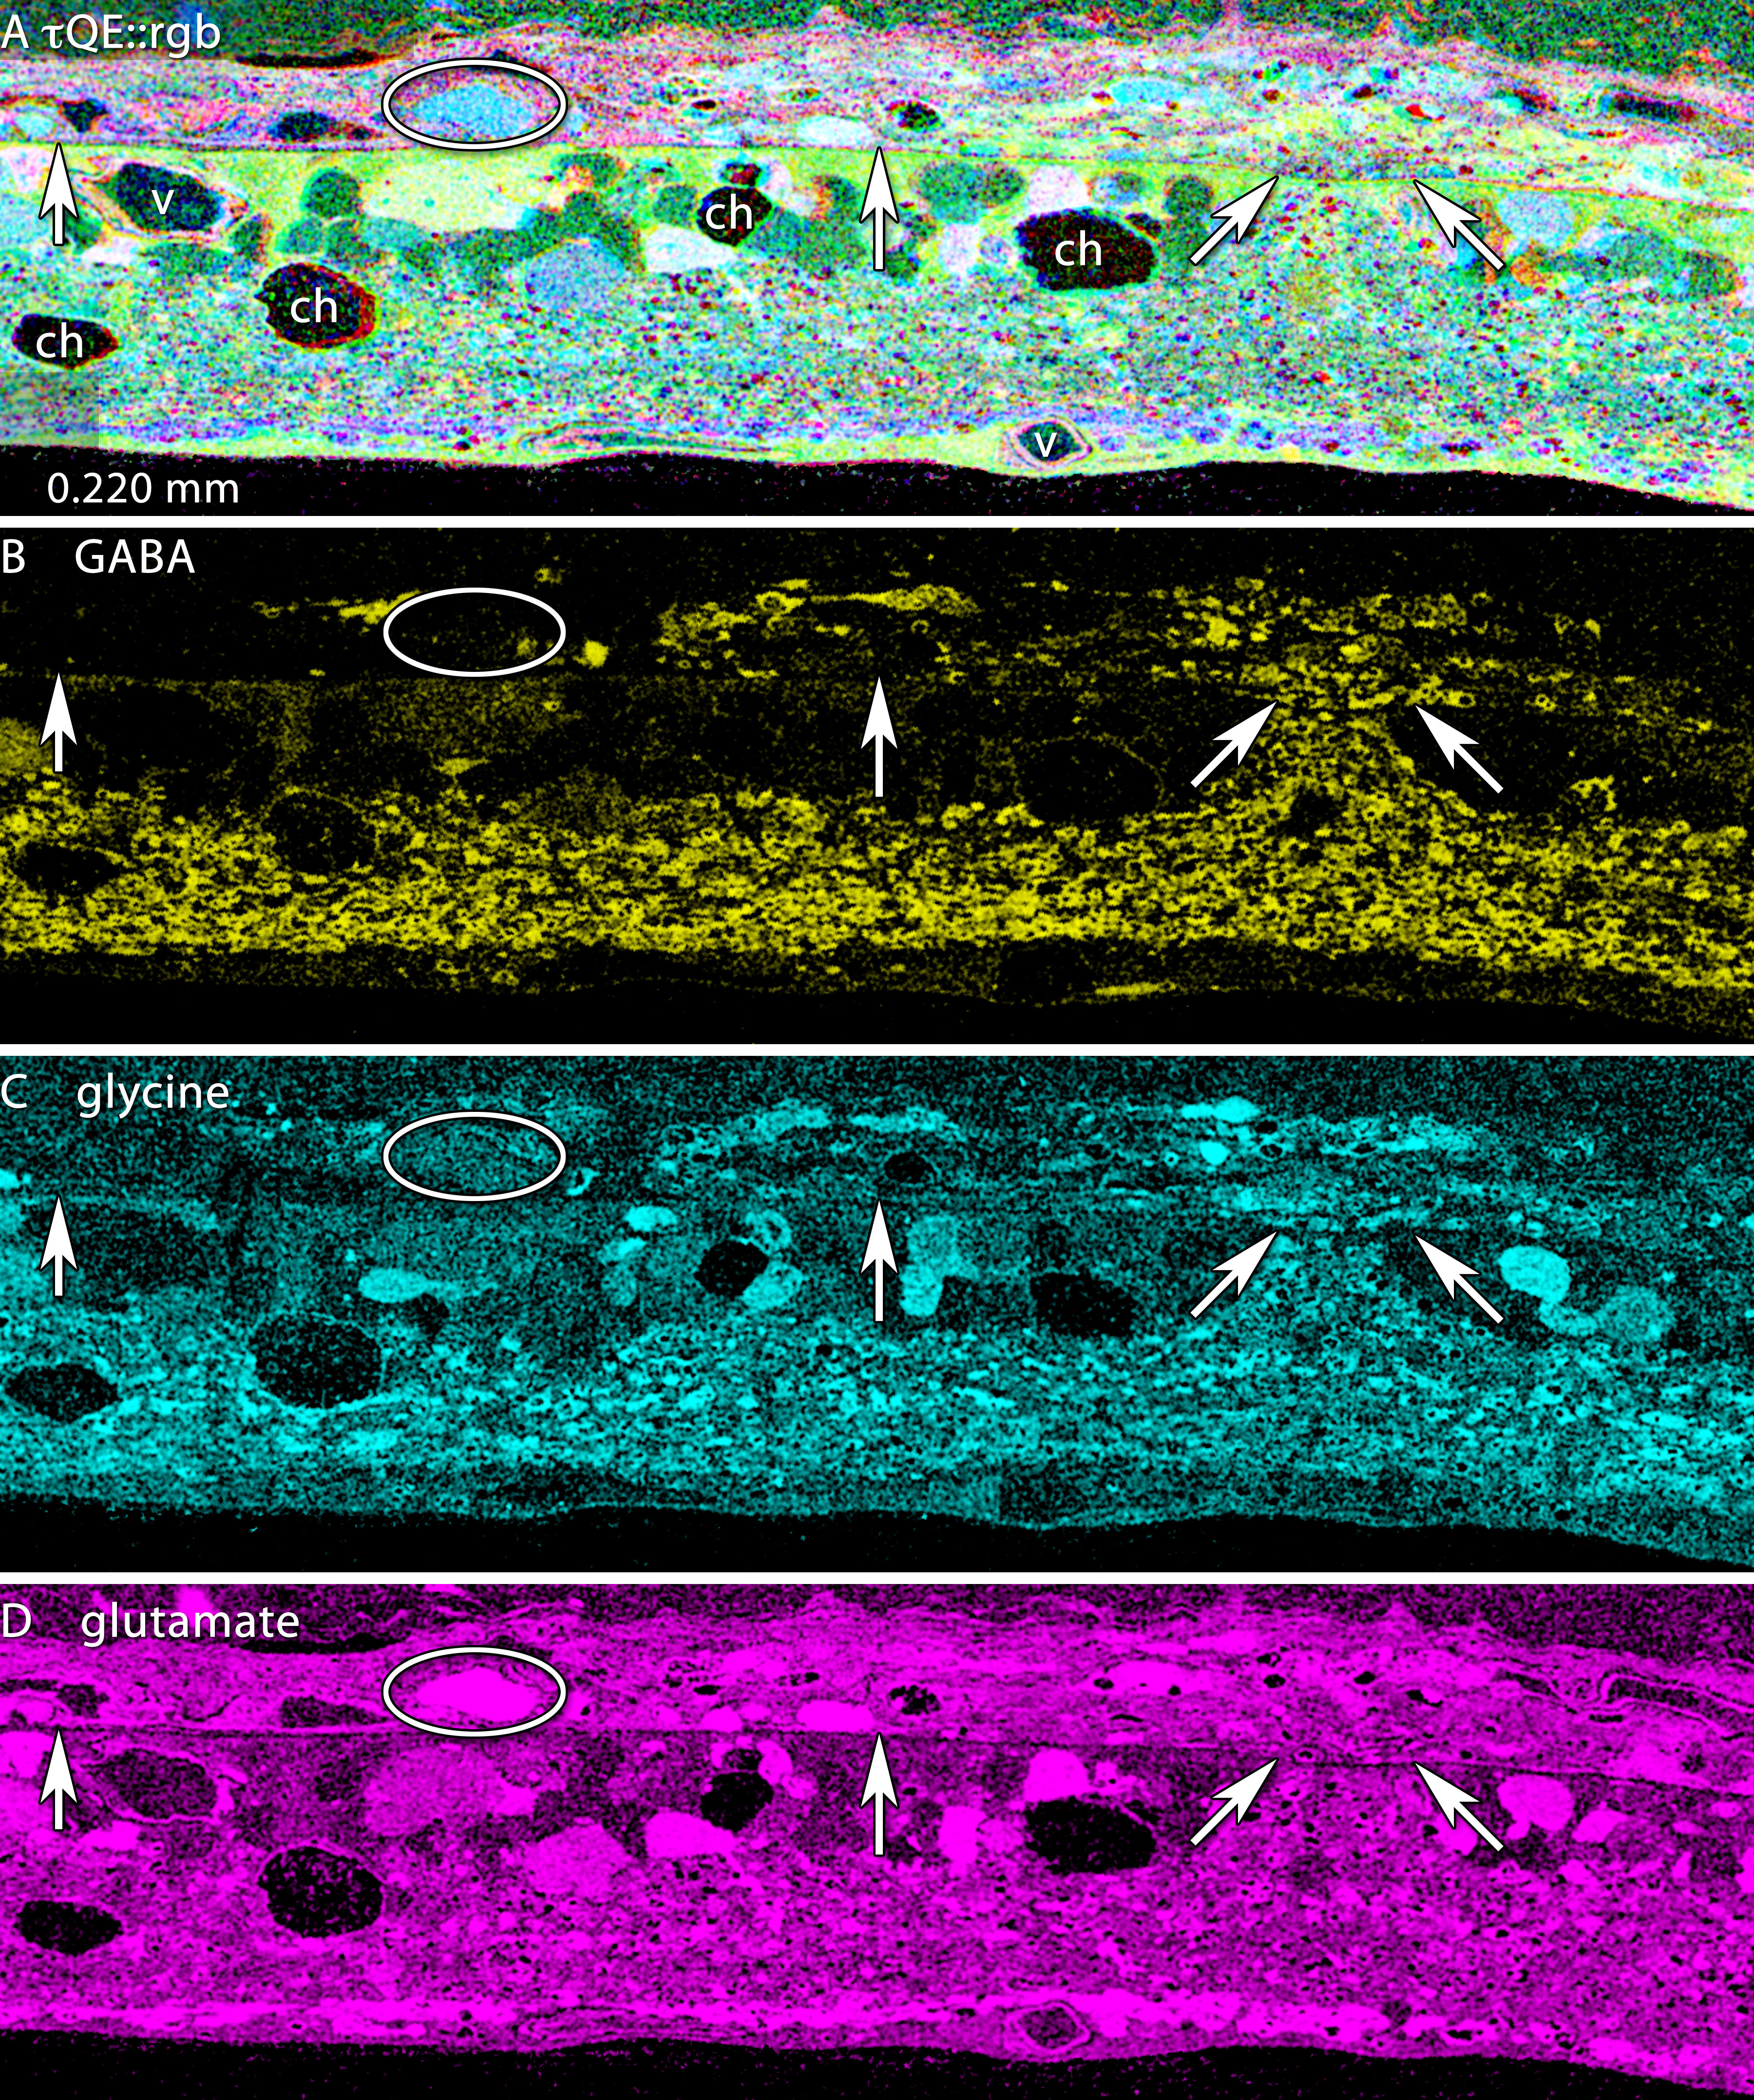
Figure 10. High resolution mapping of the eruption of neurites into the choroid. Visualization: CMP and cyan-magenta-yellow (cmy) mapped
images displayed as intensity channels. See Marc and Cameron [
29] for an explanation of cmy-mapping. Up arrows, remnant retina-choroid interface; angled arrows, eruption site; ovals, migrating
glutamate+ neurons; ch, fluid channels; v, capillary. Each panel is 0.220 mm wide.
A: τQE::rgb mapping clearly delineates the border between the remnant retina (yellow-green) and the choroid (pink). Distinctive
QE+ cyan somas characteristic of ganglion cells are in the choroid (oval).
B: γ-aminobutyric acid (GABA):yellow mapping clearly reveals both neurites and fusiform GABA+ somas deep in the choroid.
C: Glycine::cyan mapping similarly shows glycine+ profiles in the choroid.
D: Glutamate::magenta mapping shows that, while it is not possible to selectively visualize glutamate+ profiles exiting the
retina, large glutamate+ profiles are now abundant in the choroid. Sample metadata: SD Rat, age at LX 60 d, animal #P240–3L-48–240,
left eye, 48 h LX, harvested at 240 days pLX, bloc code 6693, slide code 3528.
 Figure 10 of
Marc, Mol Vis 2008; 14:782-805.
Figure 10 of
Marc, Mol Vis 2008; 14:782-805.