Figure 3. Western blot analysis of the protein for the catalytic subunits of PP-1 (PP-1cs) and PP-2A (PP-2Acs) in the retina, lens epithelium,
lens fiber, and cornea of the mouse eye. A: Fifty micrograms of total proteins extracted from different ocular tissues of the mouse eye were separated by 10% SDS–PAGE,
transferred to nitrocellulose membranes, and probed with an antibody recognizing both α and β isoforms of PP-1cs (top panel)
or an antibody recognizing both α and β isoforms of PP-2Acs (middle panel) or an antibody recognizing β-actin (bottom panel)
at 1:1000 dilution for 60 min. After three washes with TBS-T (10 mM Tris, pH 8.0; 150 mM NaCl, 0.05% Tween 20), the blots
were incubated for 45 min with anti-mouse IgG (1:1000 dilution), which was linked to peroxidase. At the end of the incubation,
the blots were washed twice with TBS-T followed by another two washes with TBS (10 mM Tris, pH 8.0; 150 mM NaCl) and finally
visualized with the Amersham ECL kit. Note that the PP-2Acs in most cases appear in two bands due to different phosphorylation
status. Molecular weight was determined according to the Bio-Rad (Hercules, CA).protein standard. B: Quantitative results of the expression of PP-1 (PP-1cs) and PP-2A (PP-2Acs) in the retina, lens epithelium, lens fiber,
and cornea of the mouse eye are shown in the chart. After exposure, the bands on each X-ray film were processed with the Automated
Digitizing System from the Silver Scientific Corporation. The relative level of expression (fold) was calculated by dividing
the averaged total pixel (from three experiments) for each band with the averaged total pixel from the corresponding β-actin
band. Note that in the retina, lens epithelium, and cornea, PP-1cs is more predominant than PP-2Acs. Since such a difference
was not so obvious at the mRNA levels, differential translation or stability of PP-2Acs may exist.
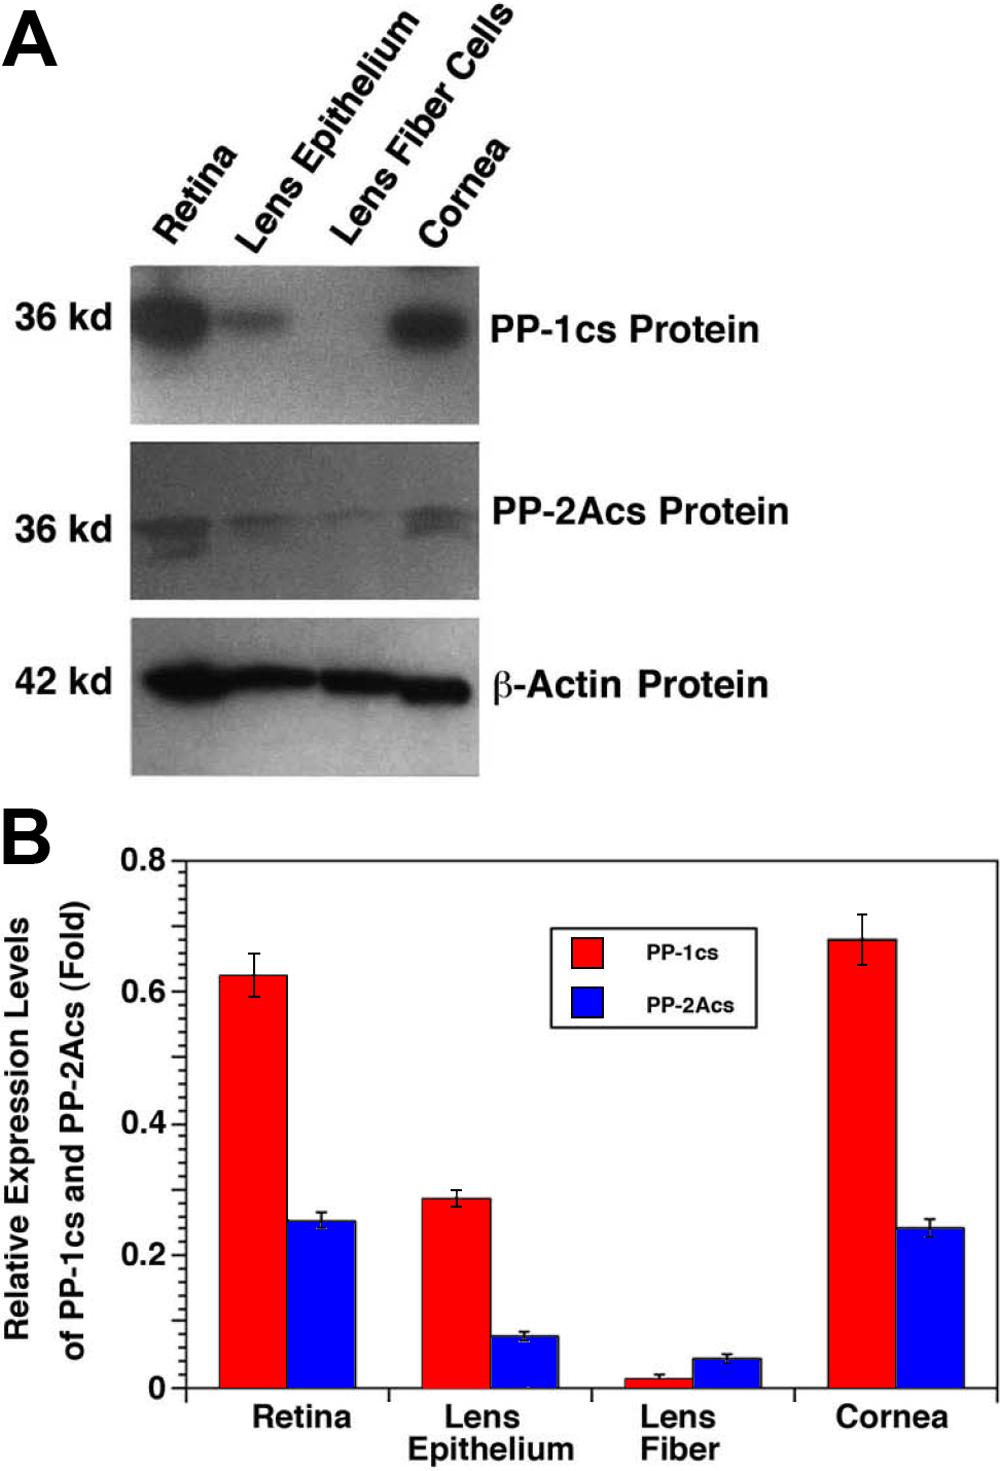
 Figure 3 of
Liu, Mol Vis 2008; 14:762-773.
Figure 3 of
Liu, Mol Vis 2008; 14:762-773.