Figure 4. AQP5 flow cytometry in epithelial cells from keratoconus cornea. A: Flow cytometry dot plot from single cell suspension from KC cornea labeled with anti-cytokeratin. The inner rectangle represents
cytokeratin positive cells B: AQP5 flow cytometry histogram is shown from cytokeratin positive cells. The continuous dark line represents AQP5+ cells;
the dashed light line represents the negative control. Inner numbers indicate media ± SEM (n=5).
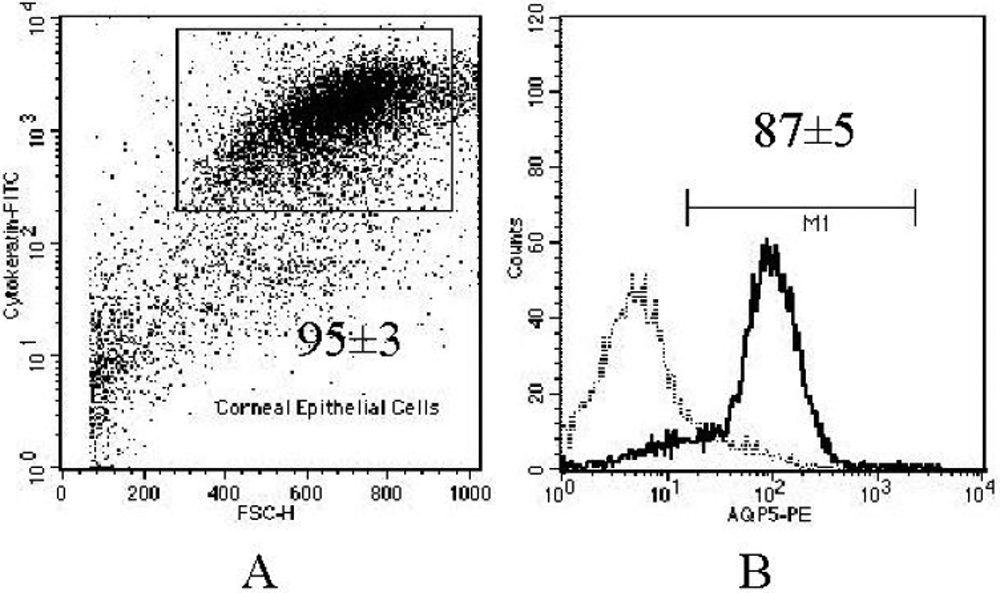
 Figure 4 of
Garfias, Mol Vis 2008; 14:756-761.
Figure 4 of
Garfias, Mol Vis 2008; 14:756-761.