Figure 2. AQP5 real time polymerase chain reaction comparative analysis in keratoconus and non-keratoconus corneal tissue. PCR products
from both samples KC and non-KC corneal tissue are shown. Curves A and B correspond to the PGK-1 gene amplification from healthy and KC corneal tissue, respectively. Curves C and D correspond to AQP5 amplification from healthy and KC corneal tissue, respectively. The x-axis represents the number of cycles, and the y-axis
represents normalized fluorescence. The graph is a representative example of five separate assays.
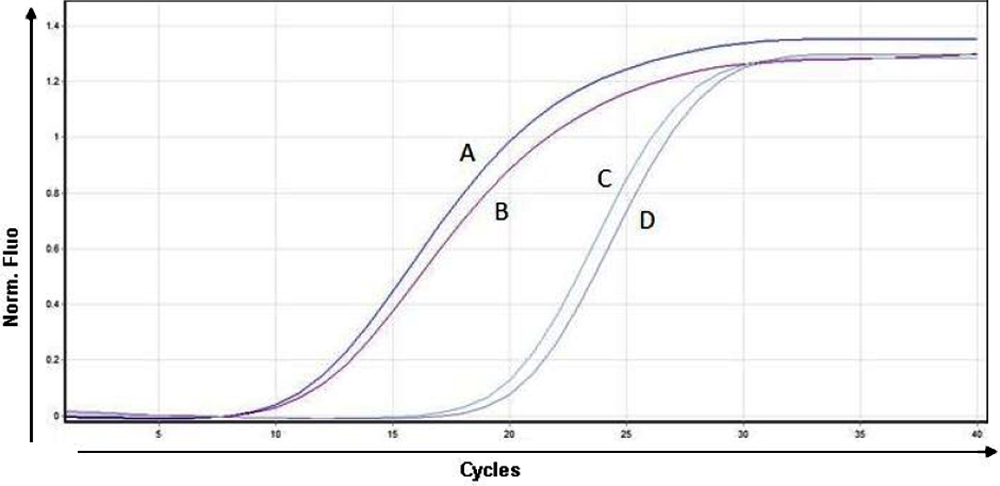
 Figure 2 of
Garfias, Mol Vis 2008; 14:756-761.
Figure 2 of
Garfias, Mol Vis 2008; 14:756-761.