![]() Figure 7 of
Hosseini, Mol Vis 2008;
14:71-80.
Figure 7 of
Hosseini, Mol Vis 2008;
14:71-80.
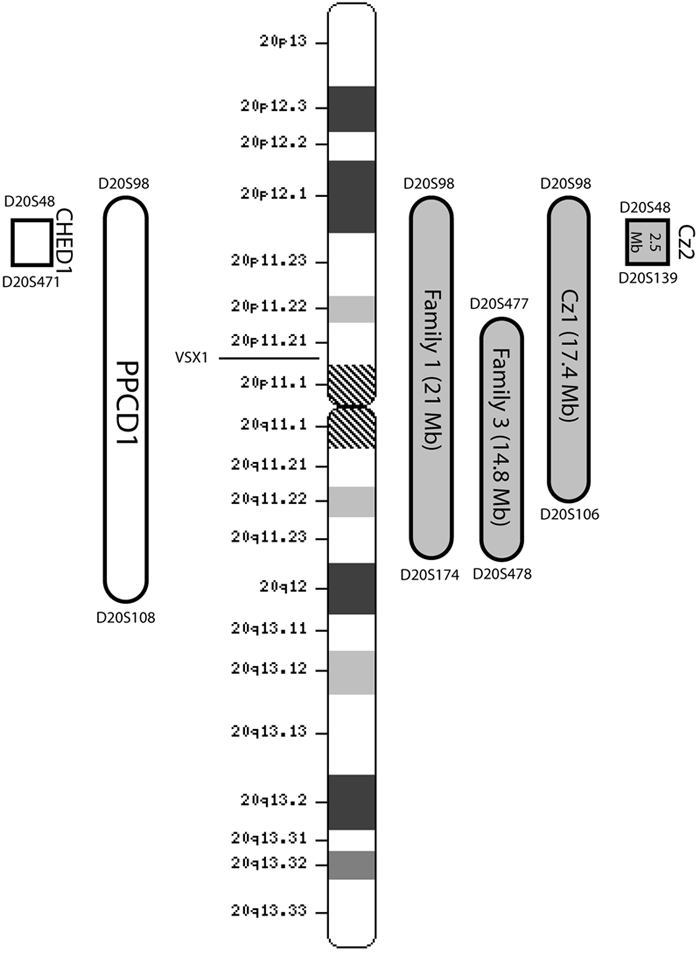
Figure 7. Ideogram of chromosome 20 showing PPCD1 minimal disease interval in different families
Bars on the left represent the disease intervals for PPCD1 and CHED1 as originally described [6,10]. Bars on the right show the refinements made in our study. Family 1 is the family used for mapping the locus (further refinement). Family 3 is the family described by Heon et al. [11] with a known VSX1 mutation. Cz1 and Cz2 represent Czech families described by Gwilliam et al. [39].