![]() Figure 2 of
Hosseini, Mol Vis 2008;
14:71-80.
Figure 2 of
Hosseini, Mol Vis 2008;
14:71-80.
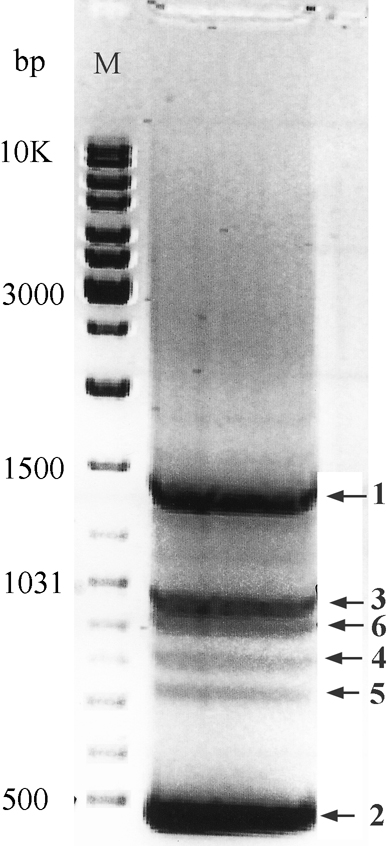
Figure 2. Photograph of ethidium bromide stained 3'RACE products electrophoresed on a 2% sieving agarose gel
Numbers on the left show the sizes of molecular marker (M) bands in bp. Numbers on the right correspond to different VSX1 transcript variants.