![]() Figure 1 of
Hosseini, Mol Vis 2008;
14:71-80.
Figure 1 of
Hosseini, Mol Vis 2008;
14:71-80.
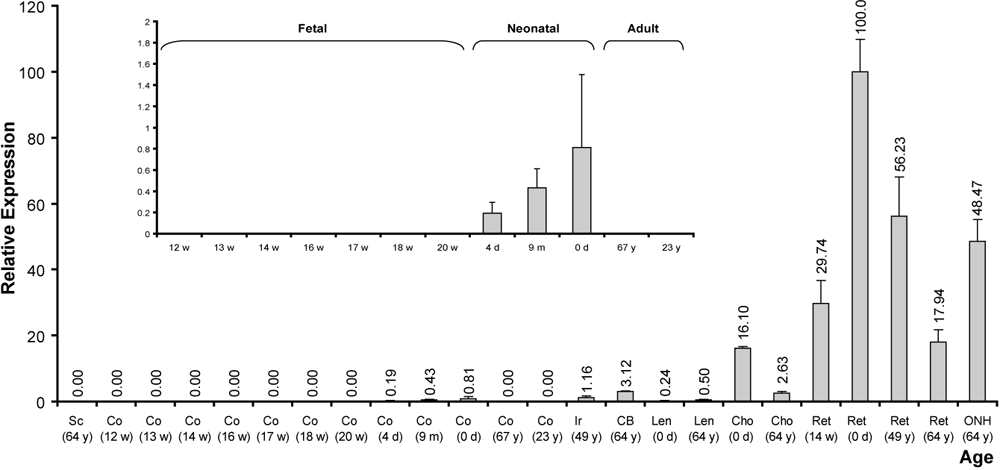
Figure 1. Relative expression of VSX1 in a panel of eye tissues of differnet ages
Each bar represents the relative expression of VSX1 normalized to GAPDH in a different tissue/age; mean±SD (Sc: sclera, Co: cornea, Ir: iris, CB: ciliary body, Len: lens, Cho: choroid, Ret: retina, ONH: optic nerve head). Numbers above each bar are the average level of expression relative to neonatal retina obtained from triplicates of the experiment. Numbers on the x-axis are the age of donor individuals (w: fetal week, y: year, m: month, d: day). Data for corneal samples is shown expanded in the inset.
