Figure 3. Variations of intraocular pressure (IOP) from the 24 h means in CBA/CaJ and C57BL/6J mice. Error bars represent SEM. Dashed
line represents the zero variation from the 24 h IOP mean. A time-dependent IOP rise during the period of 4–7 PM only appeared
in the C57BL/6J strain.
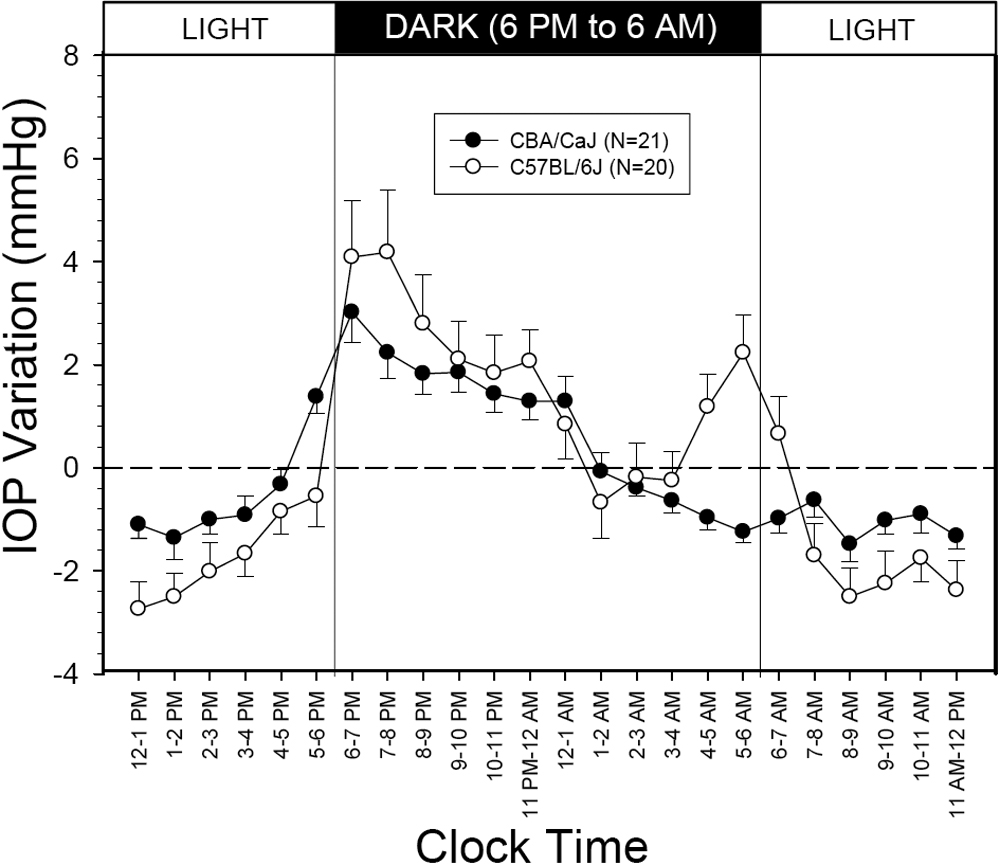
 Figure 3 of
Li, Mol Vis 2008; 14:745-749.
Figure 3 of
Li, Mol Vis 2008; 14:745-749.