Figure 2. Change pattern of 24 h intraocular pressure (IOP) in C57BL/6J mice. Error bars represent SEM. Repeated measures ANOVA indicated
a statistical difference in the hourly IOP averages under the standard light-dark and the acute constant dark conditions but
not in the control experiment.
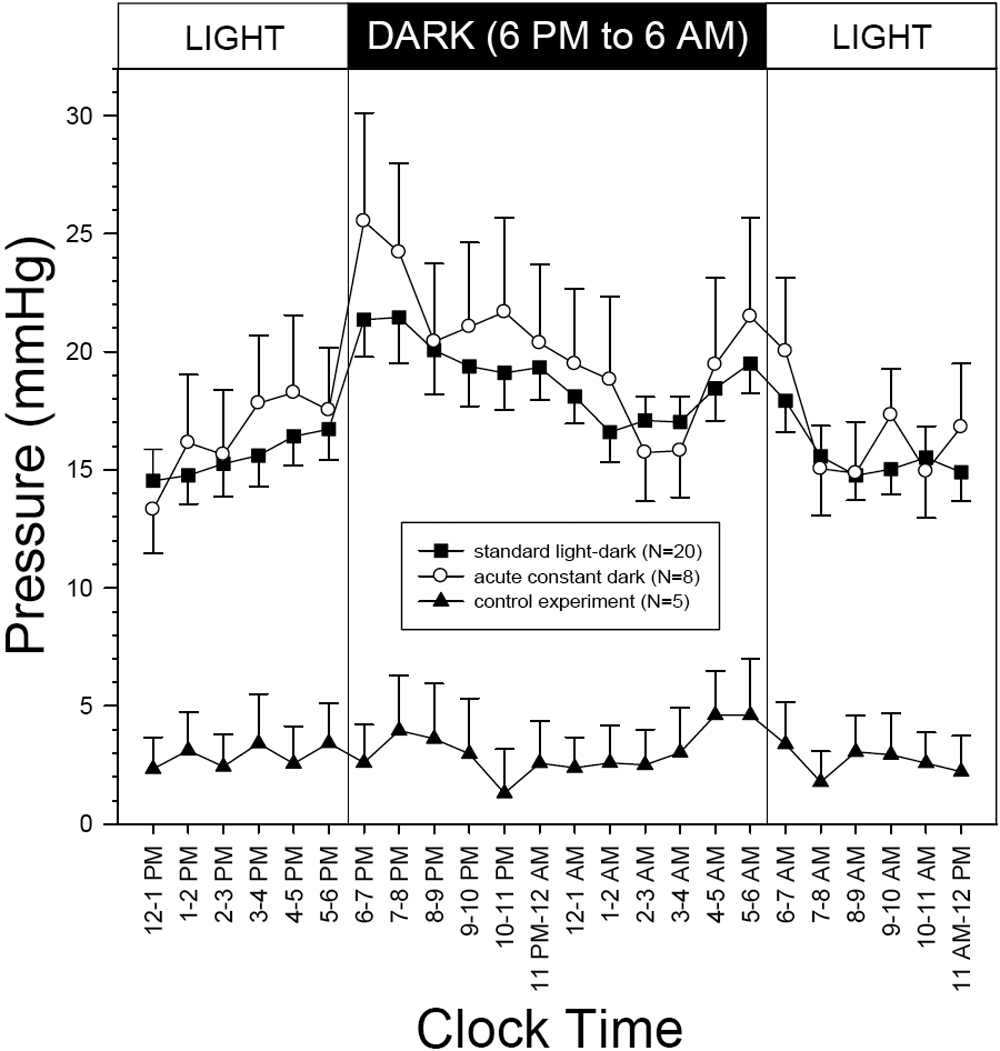
 Figure 2 of
Li, Mol Vis 2008; 14:745-749.
Figure 2 of
Li, Mol Vis 2008; 14:745-749.