Figure 1. Continuous 13 day record of intraocular pressure (IOP) in one conscious and freely moving C57BL/6J mouse. Recording started
at noon under the 12 h light (6 AM to 6 PM) and 12 h dark cycle. Each dot represents a 2 min IOP mean for a 5 min interval.
The trend-line was determined using the moving average of 72 data points. The recording system failed near the end of 13 days.
A spontaneous IOP fluctuation seen on day 4 in this mouse could appear anytime during the data collection periods in other
mice.
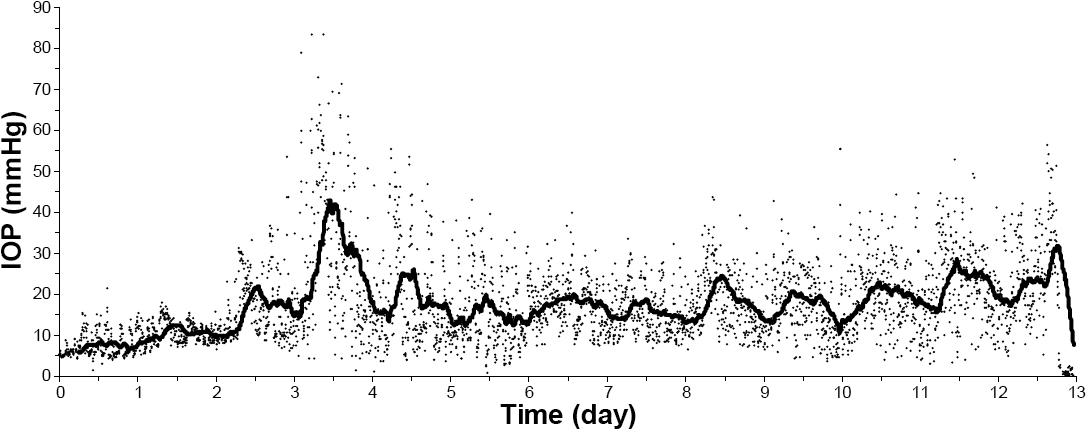
 Figure 1 of
Li, Mol Vis 2008; 14:745-749.
Figure 1 of
Li, Mol Vis 2008; 14:745-749.