Figure 6. Photoreceptors change orientation to their target depending on whether there is attraction or repulsion. A: The axonal or nuclear pole of the cell was designated to be 0 degrees. Here a rod photoreceptor, repelled by its target cell,
rotated over time so that the nuclear pole faced away from the target cell by seven days in culture. B: In this pair, a cone cell was plated at an orientation so that the nuclear pole was approximately 135 degrees away from the
target cell. Over time, the cell rotated to bring the nuclear pole within about 45 degrees of the target cell. The cone was
attracted to its target cell. Scale bar equals 20 µm. C: The difference between the percent which rotated toward and the percent which rotated away from their target cells was calculated
for attracted (n=77) and repulsed pairs (n=51) to give the net percent of cells that rotated toward or away from their target
cell. There was a significant association between attraction and repulsion and change in orientation of the cell (p=0.01)
using χ2 analysis.
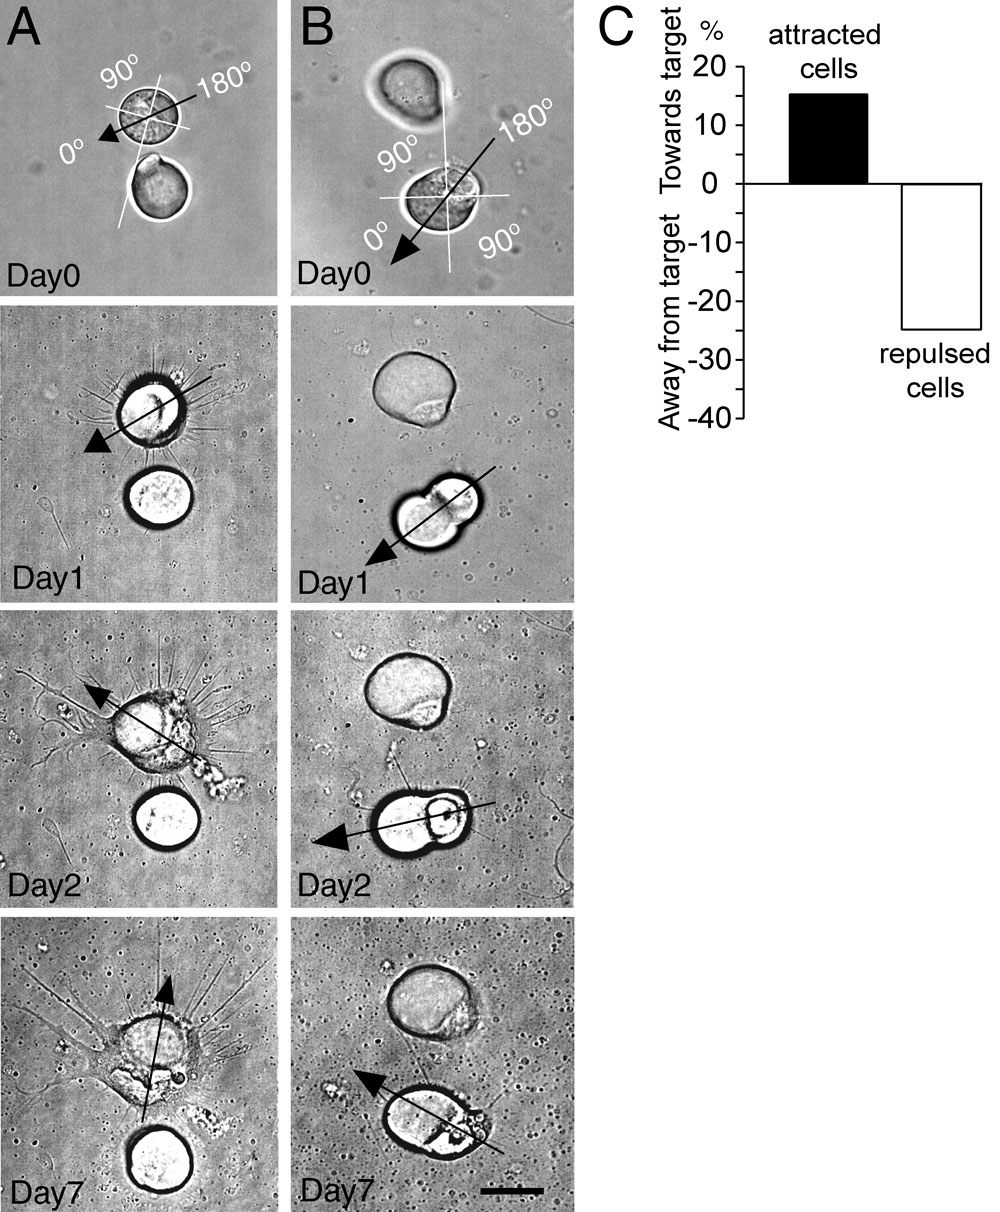
 Figure 6 of
Clarke, Mol Vis 2008; 14:706-720.
Figure 6 of
Clarke, Mol Vis 2008; 14:706-720.