Figure 5. Varicosity development changes depending on cell pair interactions. A: For cones (n=105) and rods (n=133), the total number of varicosities did not depend on whether there was attraction or repulsion
to the paired cell. The trend toward more varicosities in cells attracted to their target was not significant. B: However, the number of varicosities formed by photoreceptors was increased if contact with the target cell was present in
one-week cultures (asterisk denotes p<0.05, tested with the Mann–Whitney test). C: Looking at the cone and rod cells separately, the average number of varicosities made by cone cells was significantly increased
if contact was made with the target cell (asterisk denotes p<0.05, Mann–Whitney test; the n’s are the same as above). D: For rod cells, but not cones, the number of varicosities was significantly increased with contact when only those cells that
made varicosities were analyzed (asterisk denotes p<0.05, Mann–Whitney test). Sixty-two of 105 cone cells had varicosities;
95 of 133 rod cells had varicosities.
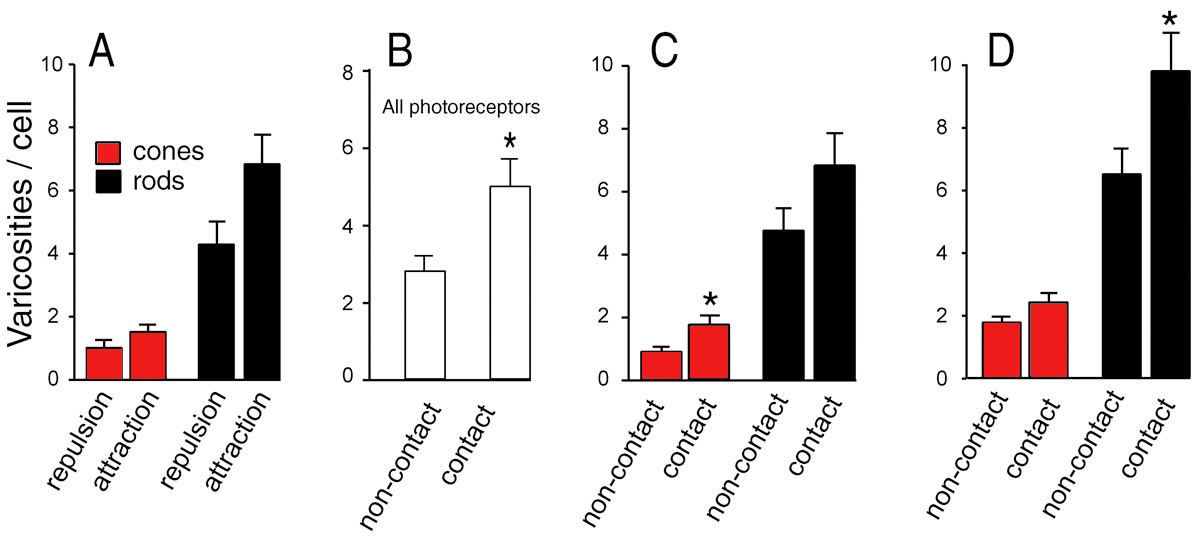
 Figure 5 of
Clarke, Mol Vis 2008; 14:706-720.
Figure 5 of
Clarke, Mol Vis 2008; 14:706-720.