Figure 3. Analysis of attraction and repulsion between photoreceptors and their target cells. A: Cell pairs were classed as either showing attraction, repulsion, or undetermined, which means showing neither attraction
nor repulsion. There were 89 pairs with cone cells and 114 pairs with rod cells. Cone cells were significantly more attracted
than repulsed by bipolar cells. Rod cells were significantly more attracted than repulsed by bipolar cells and, when paired
with multipolar cells, were also significantly more attracted than repulsed by them. Significance (asterisk denotes p<0.05)
was tested with the exact binomial test. B: The net percent of attraction or repulsion was computed by subtracting the percent of repulsed pairs from the percent of
attracted pairs. Although rods were attracted to both multipolar and bipolar cells, they were significantly more attracted
to multipolar cells than bipolar cells. Cones, on the other hand, were more attracted to bipolar than multipolar cells. Significance
(asterisk denotes p<0.05) was determined with the Pearson χ2 test.
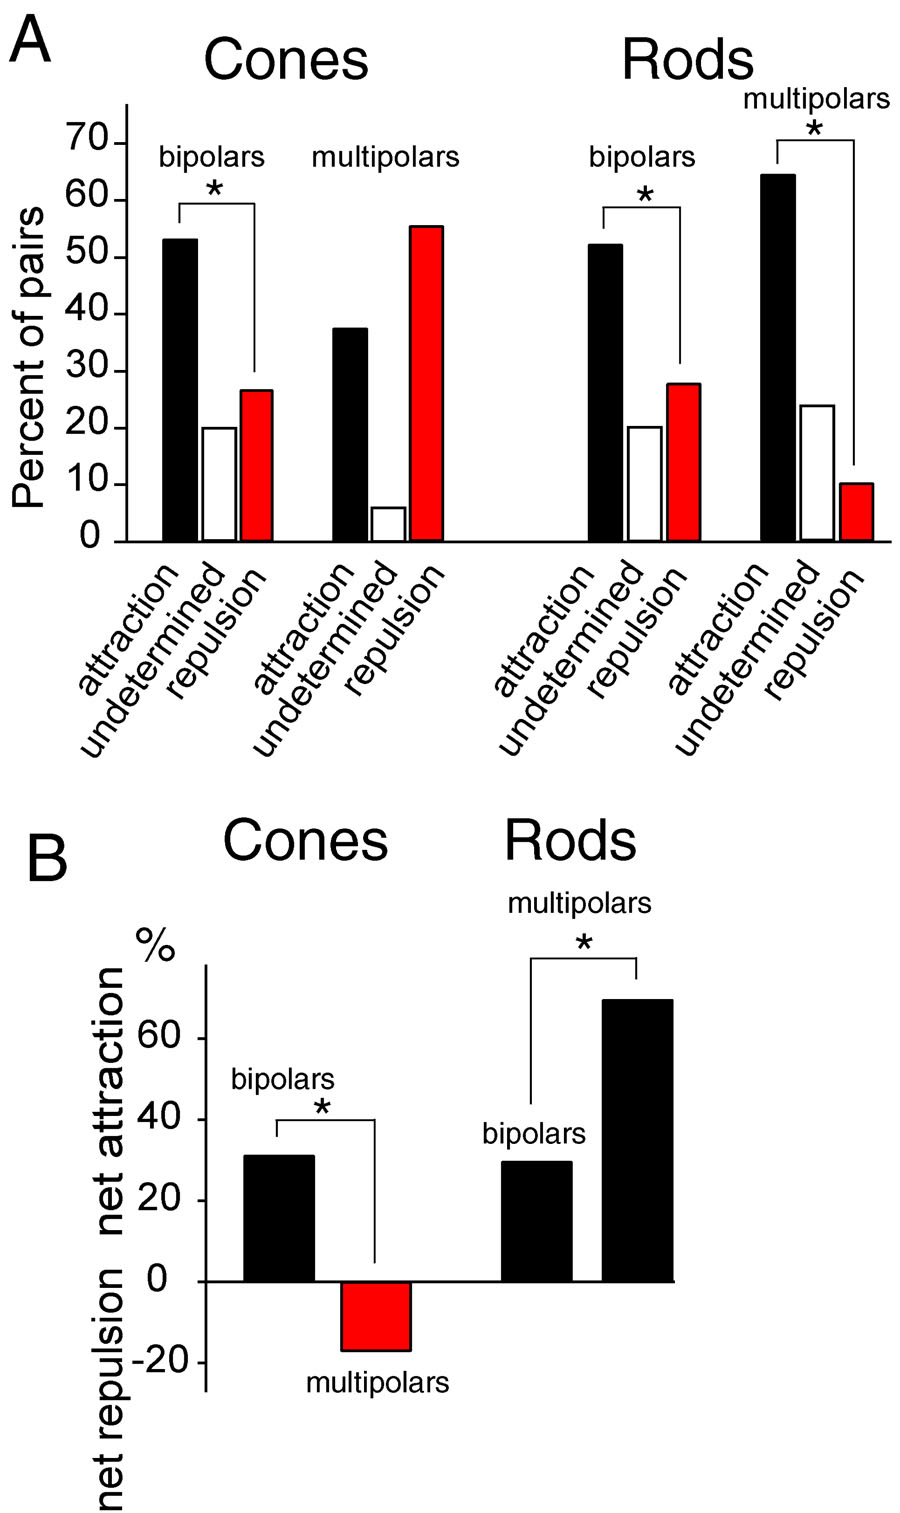
 Figure 3 of
Clarke, Mol Vis 2008; 14:706-720.
Figure 3 of
Clarke, Mol Vis 2008; 14:706-720.